
Next Generation Hydrogen Station Composite Data Products: All Stations
The following composite data products (CDPs) focus on next generation hydrogen stations and include data from all stations (retail and non-retail combined). Also view CDPs for retail stations.
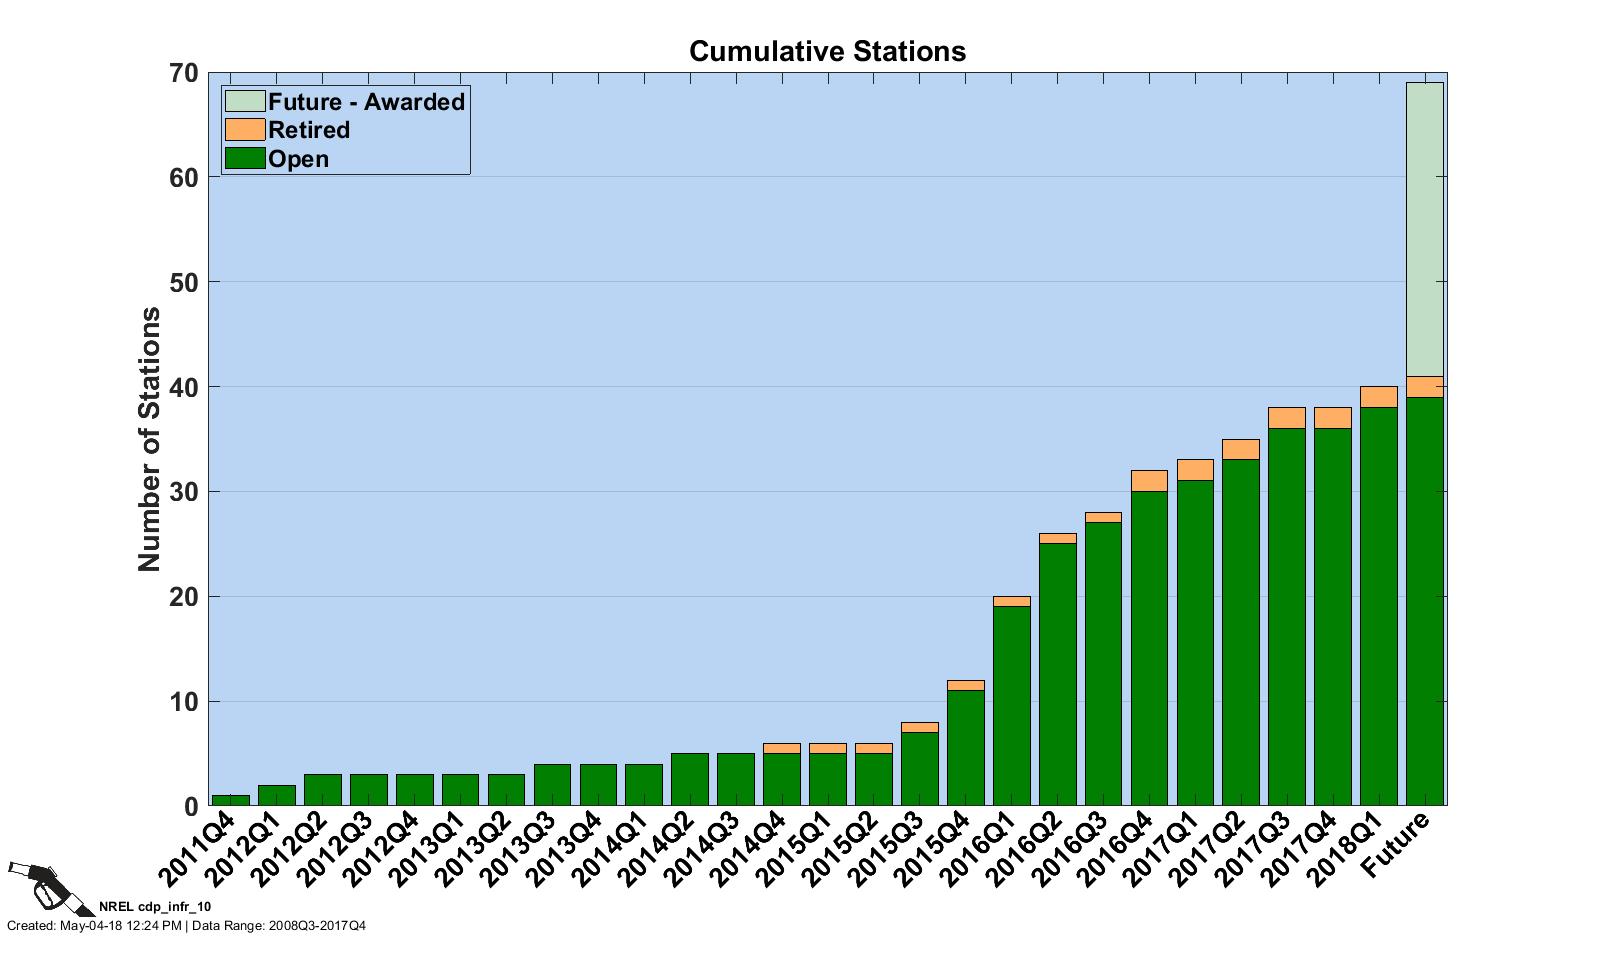
Cumulative Number of Stations
CDP INFR 10, 5/4/18
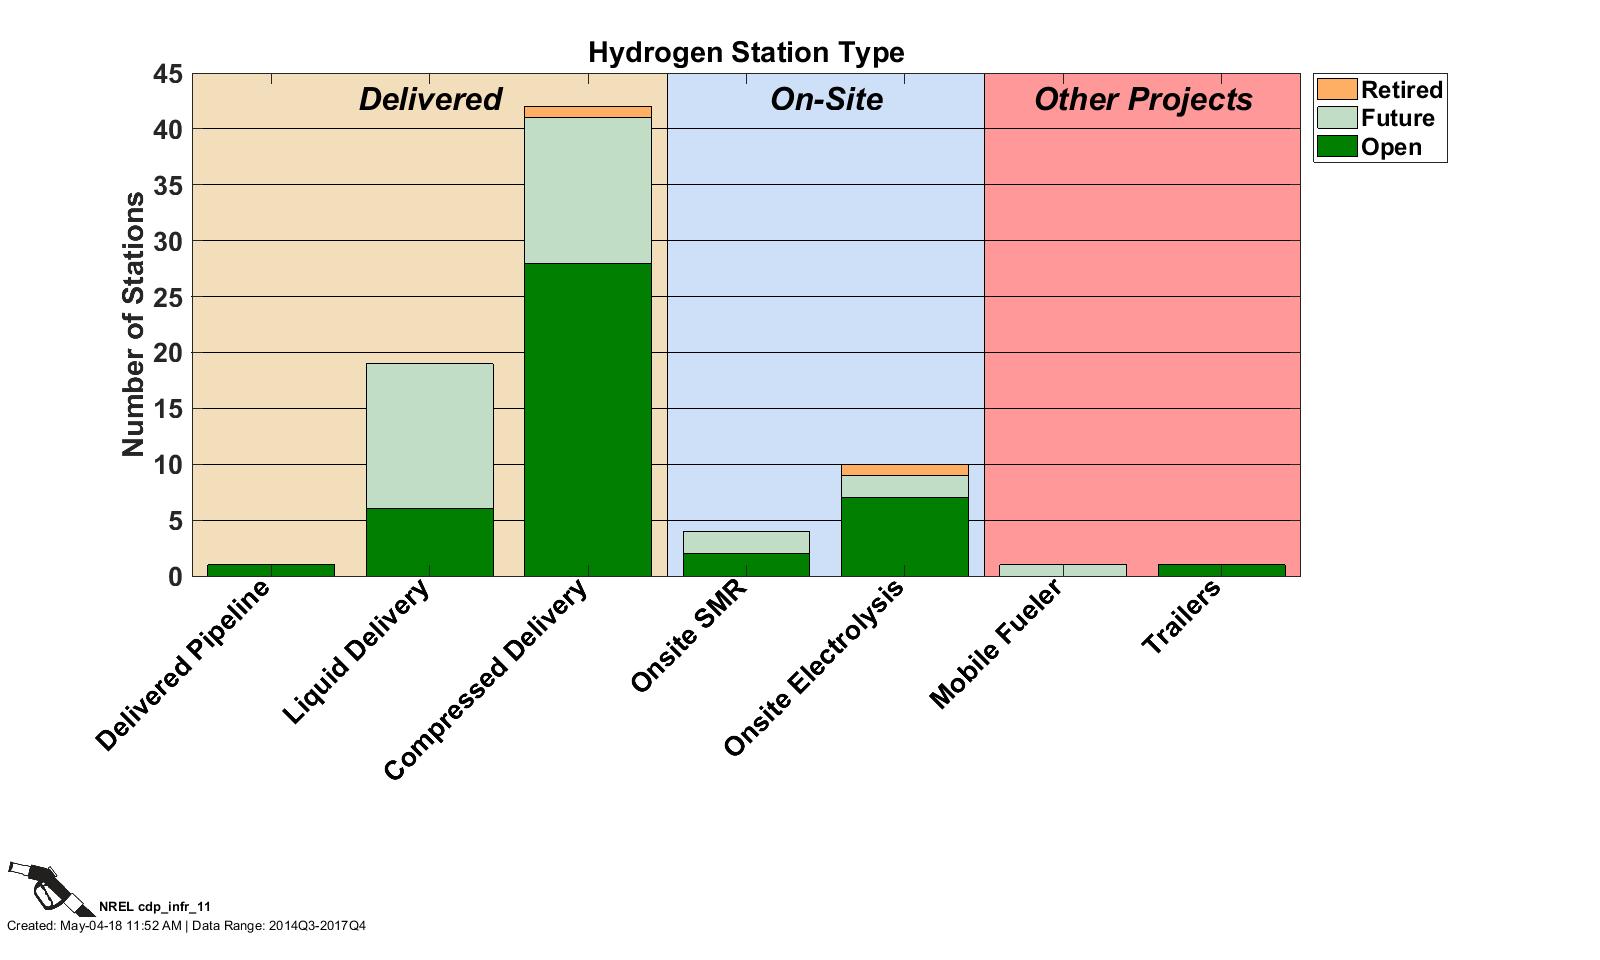
Hydrogen Stations by Type
CDP INFR 11, 5/4/18
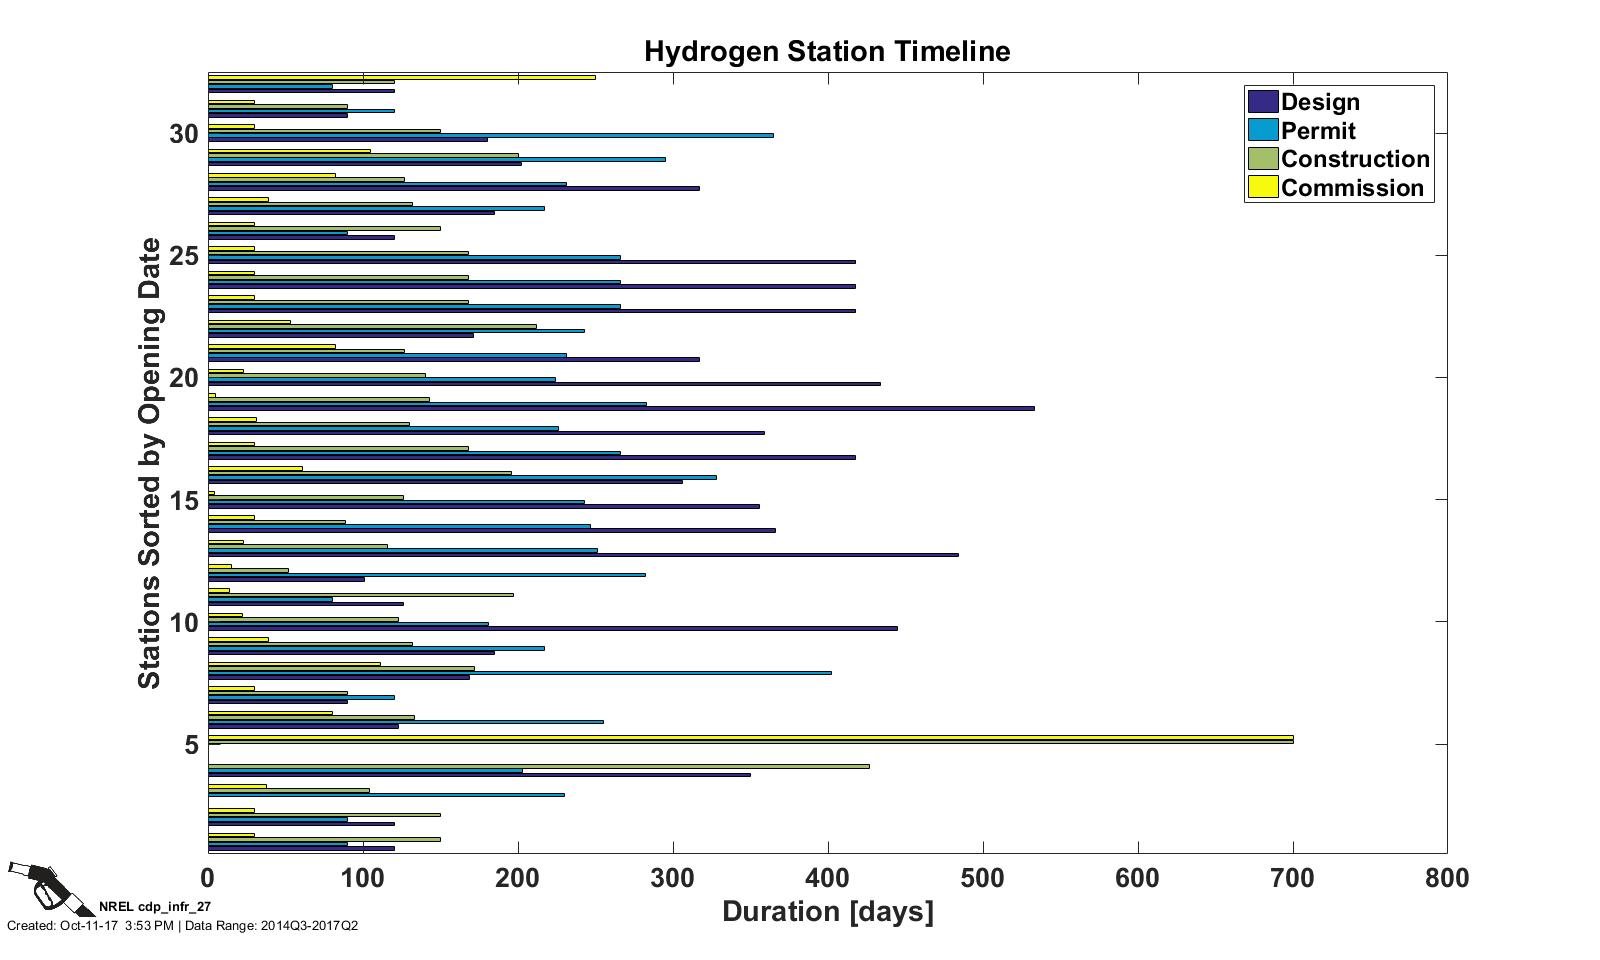
Hydrogen Station Timeline
CDP INFR 27, 10/11/17
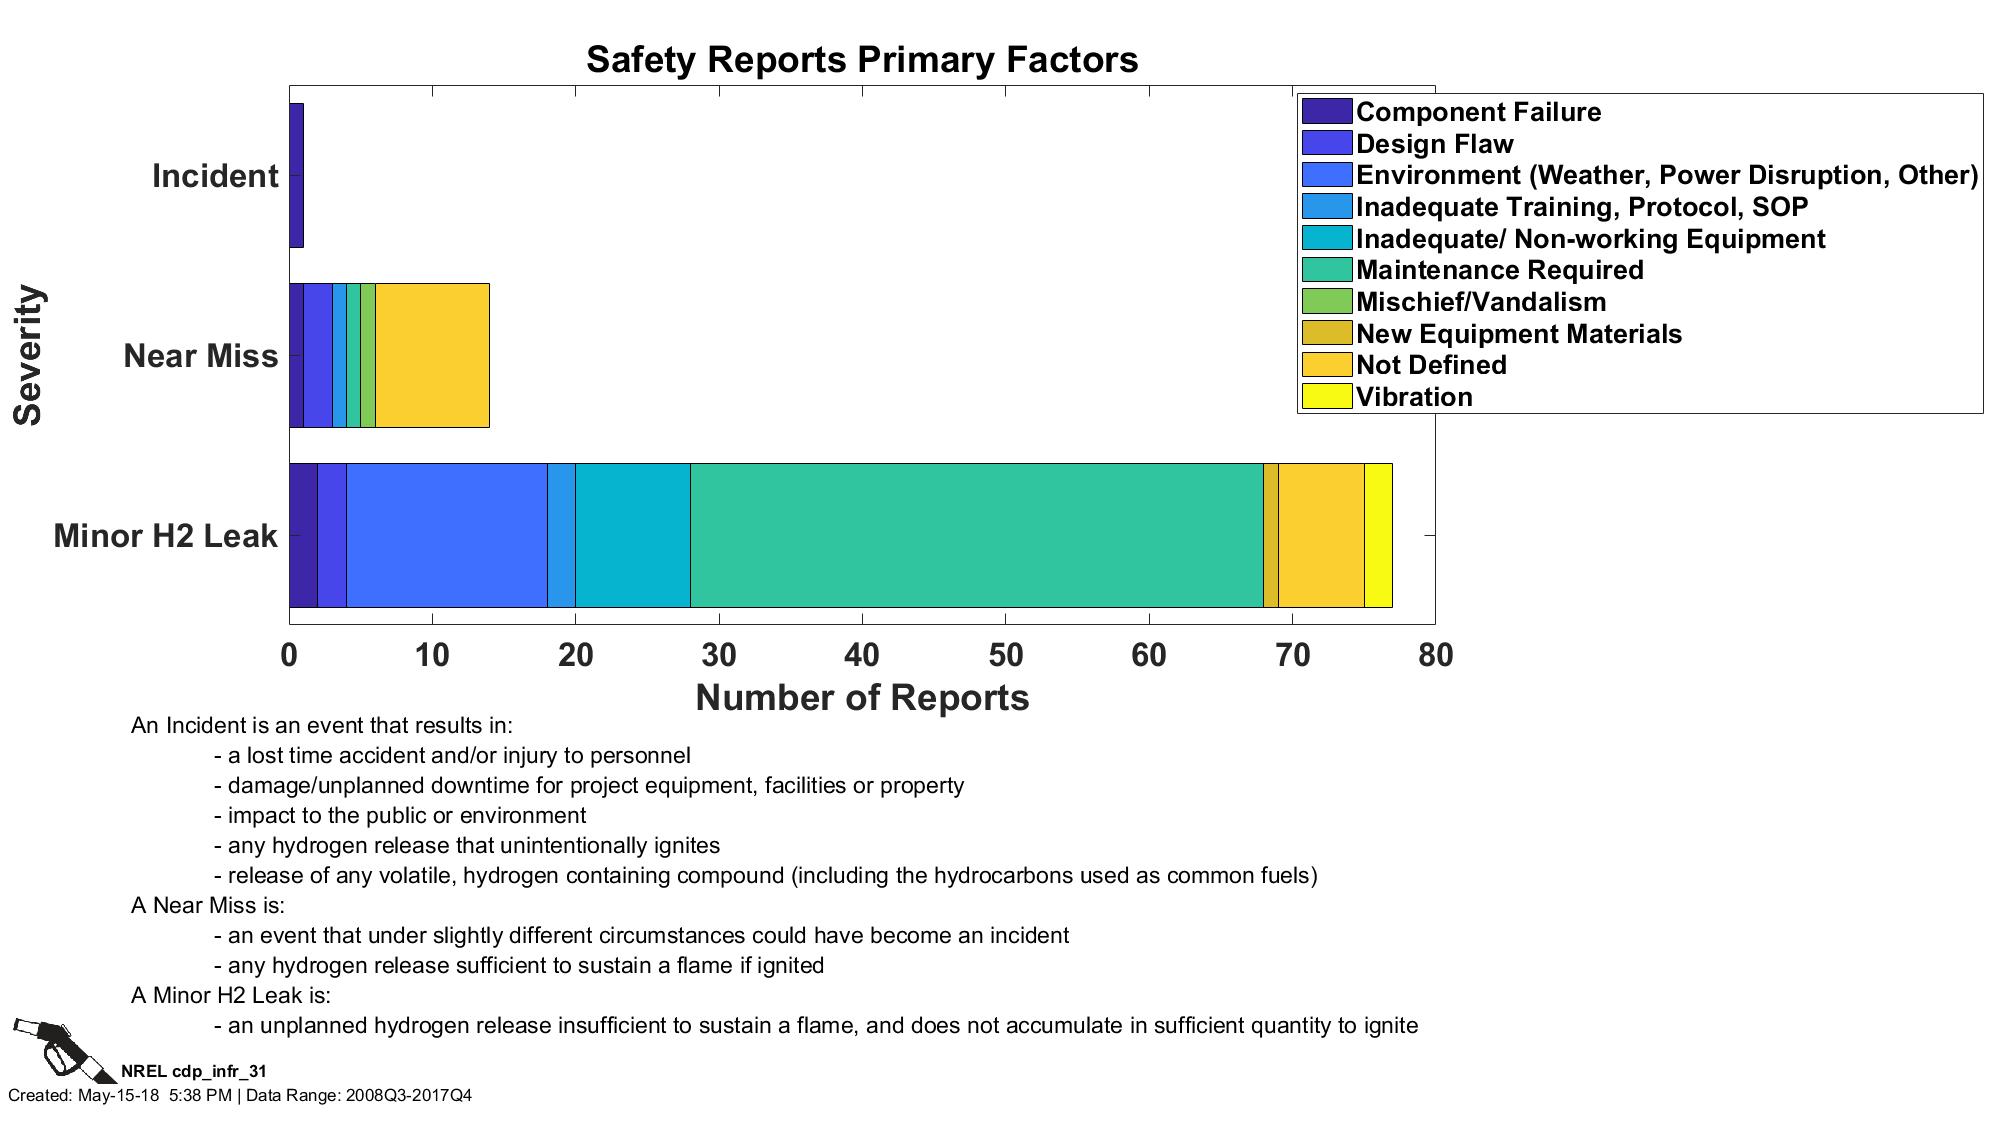
Safety Reports Primary Factors
CDP INFR 31, 5/15/18
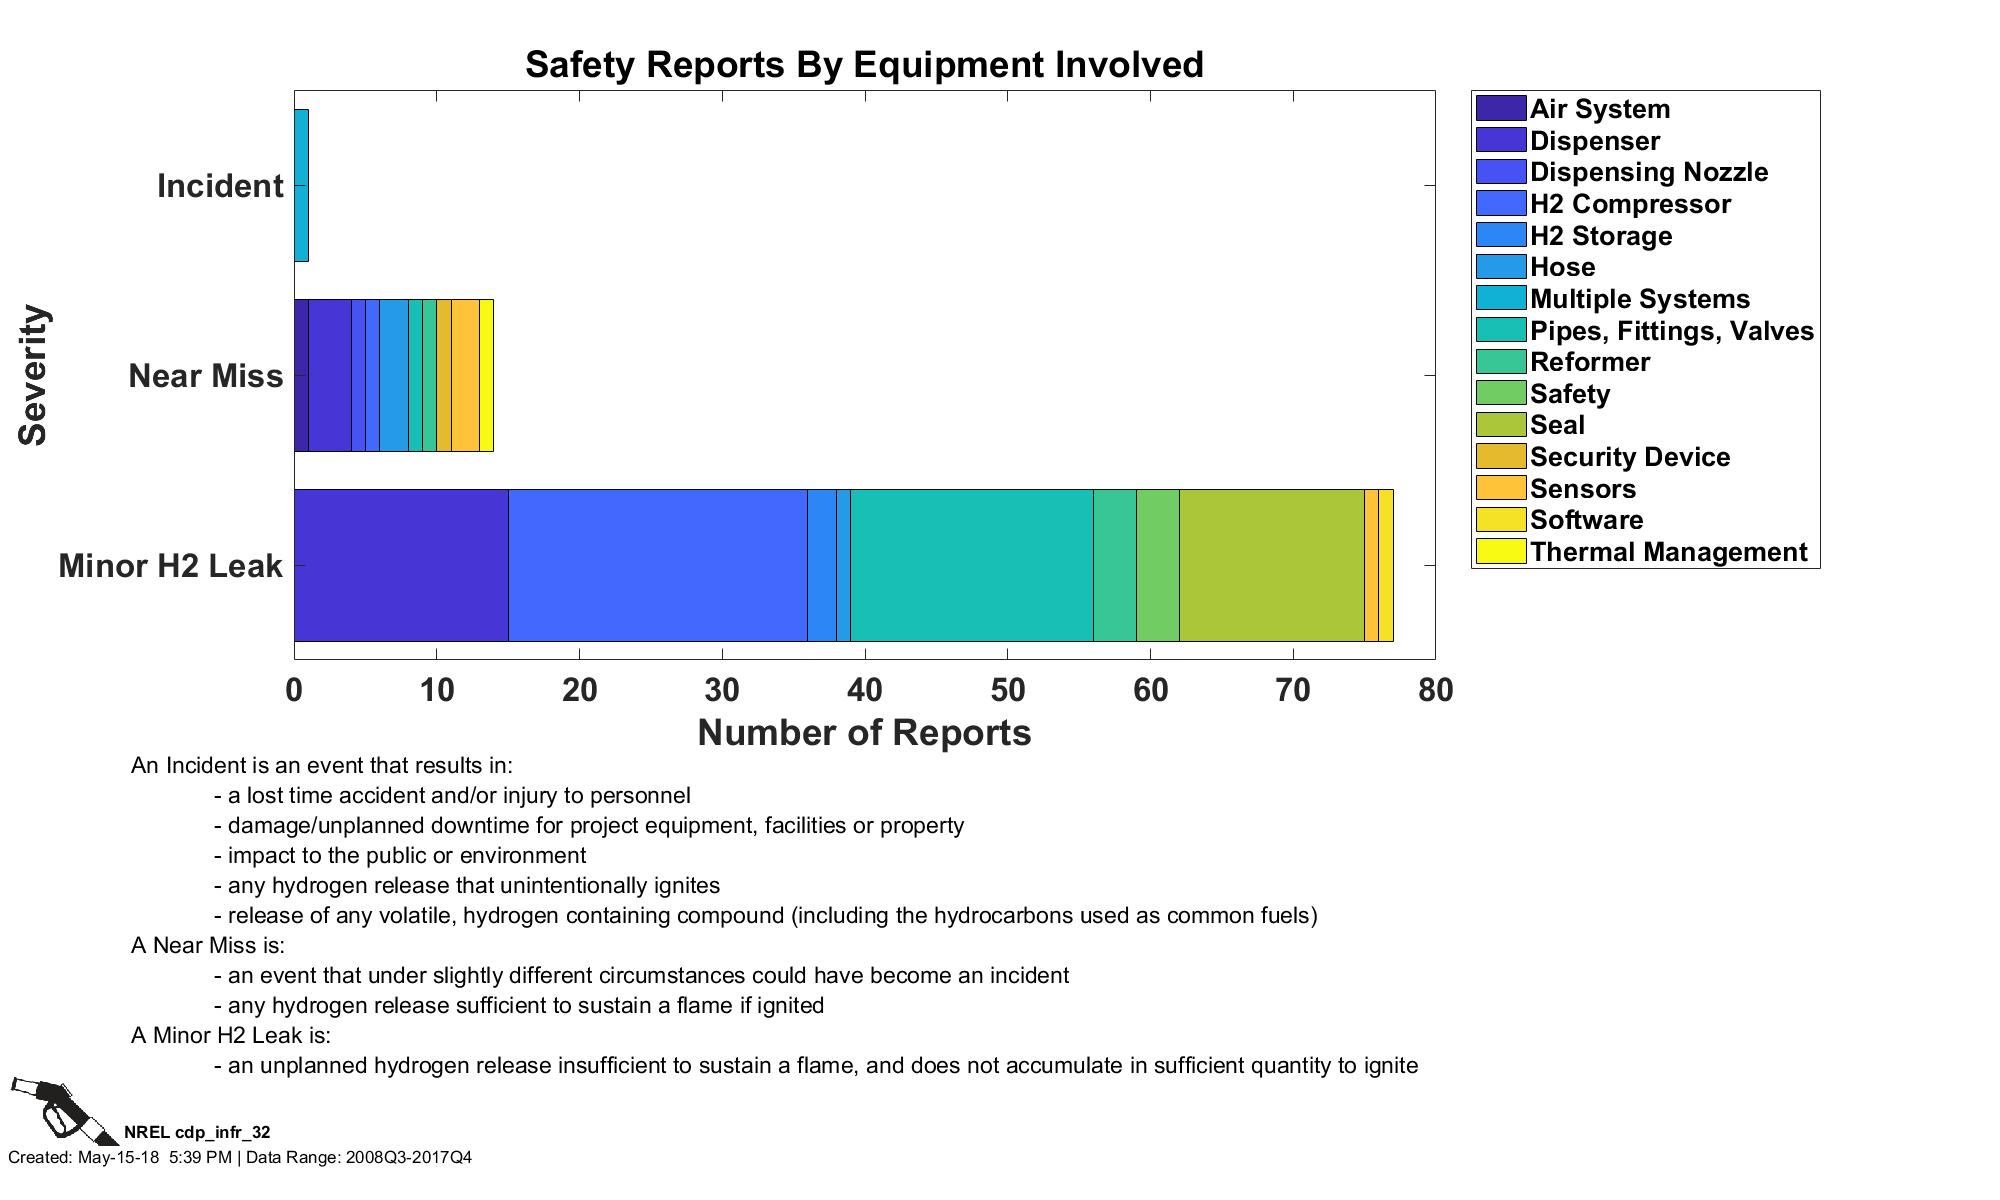
Safety Reports by Equipment Involved
CDP INFR 32, 5/15/18
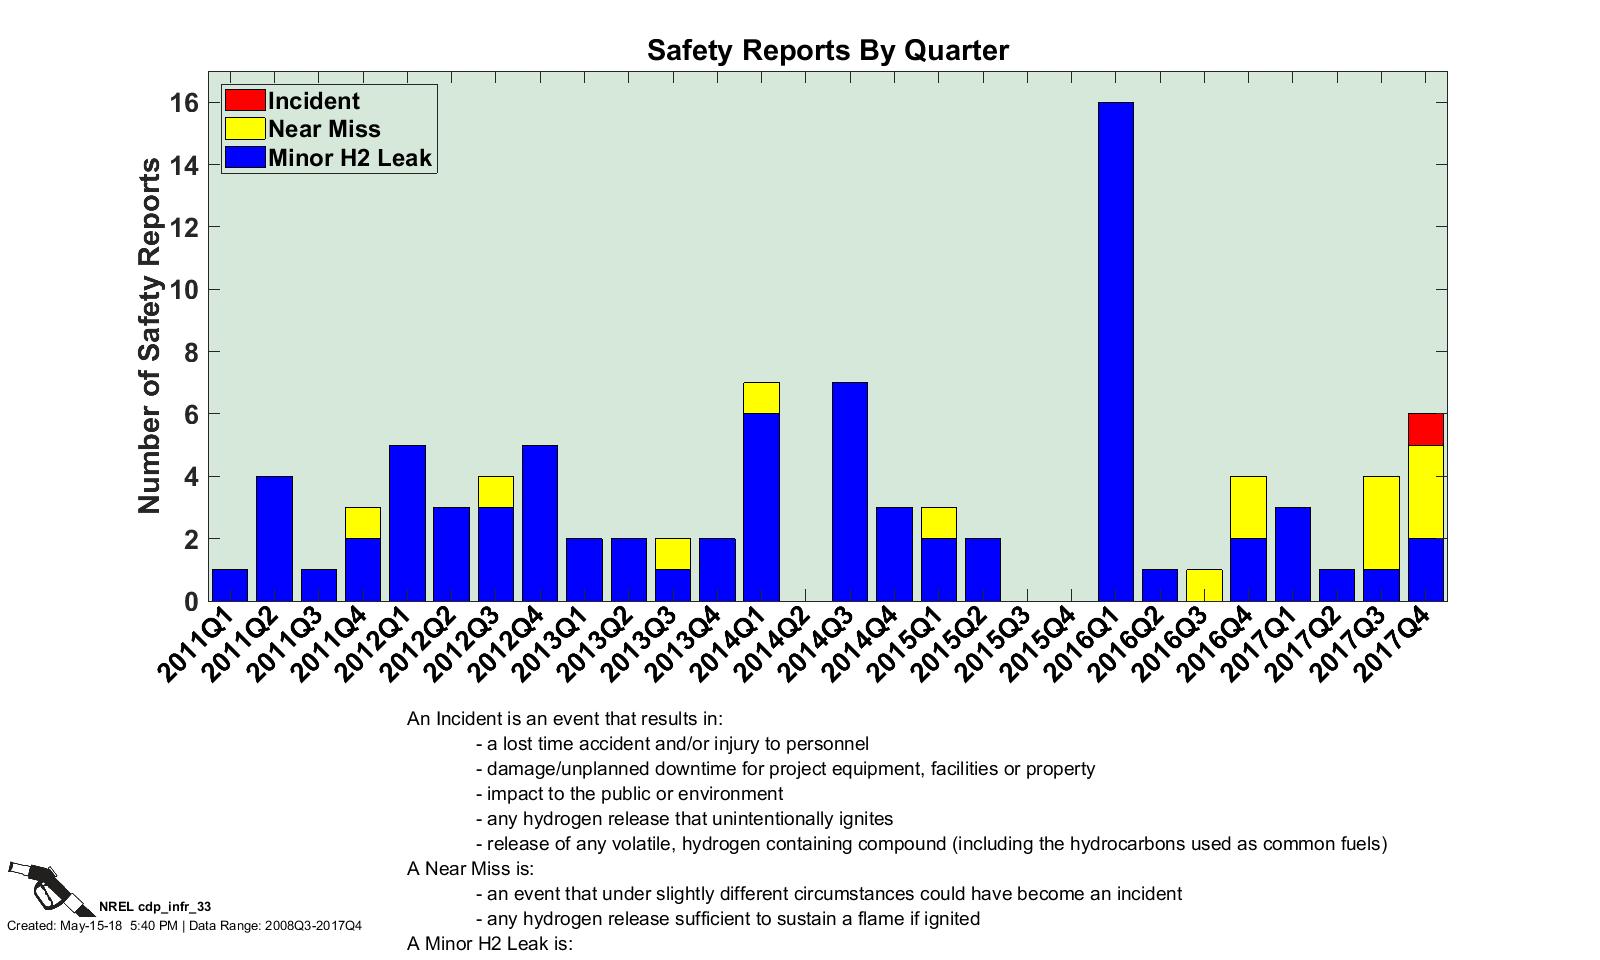
Safety Reports by Quarter
CDP INFR 33, 5/15/18
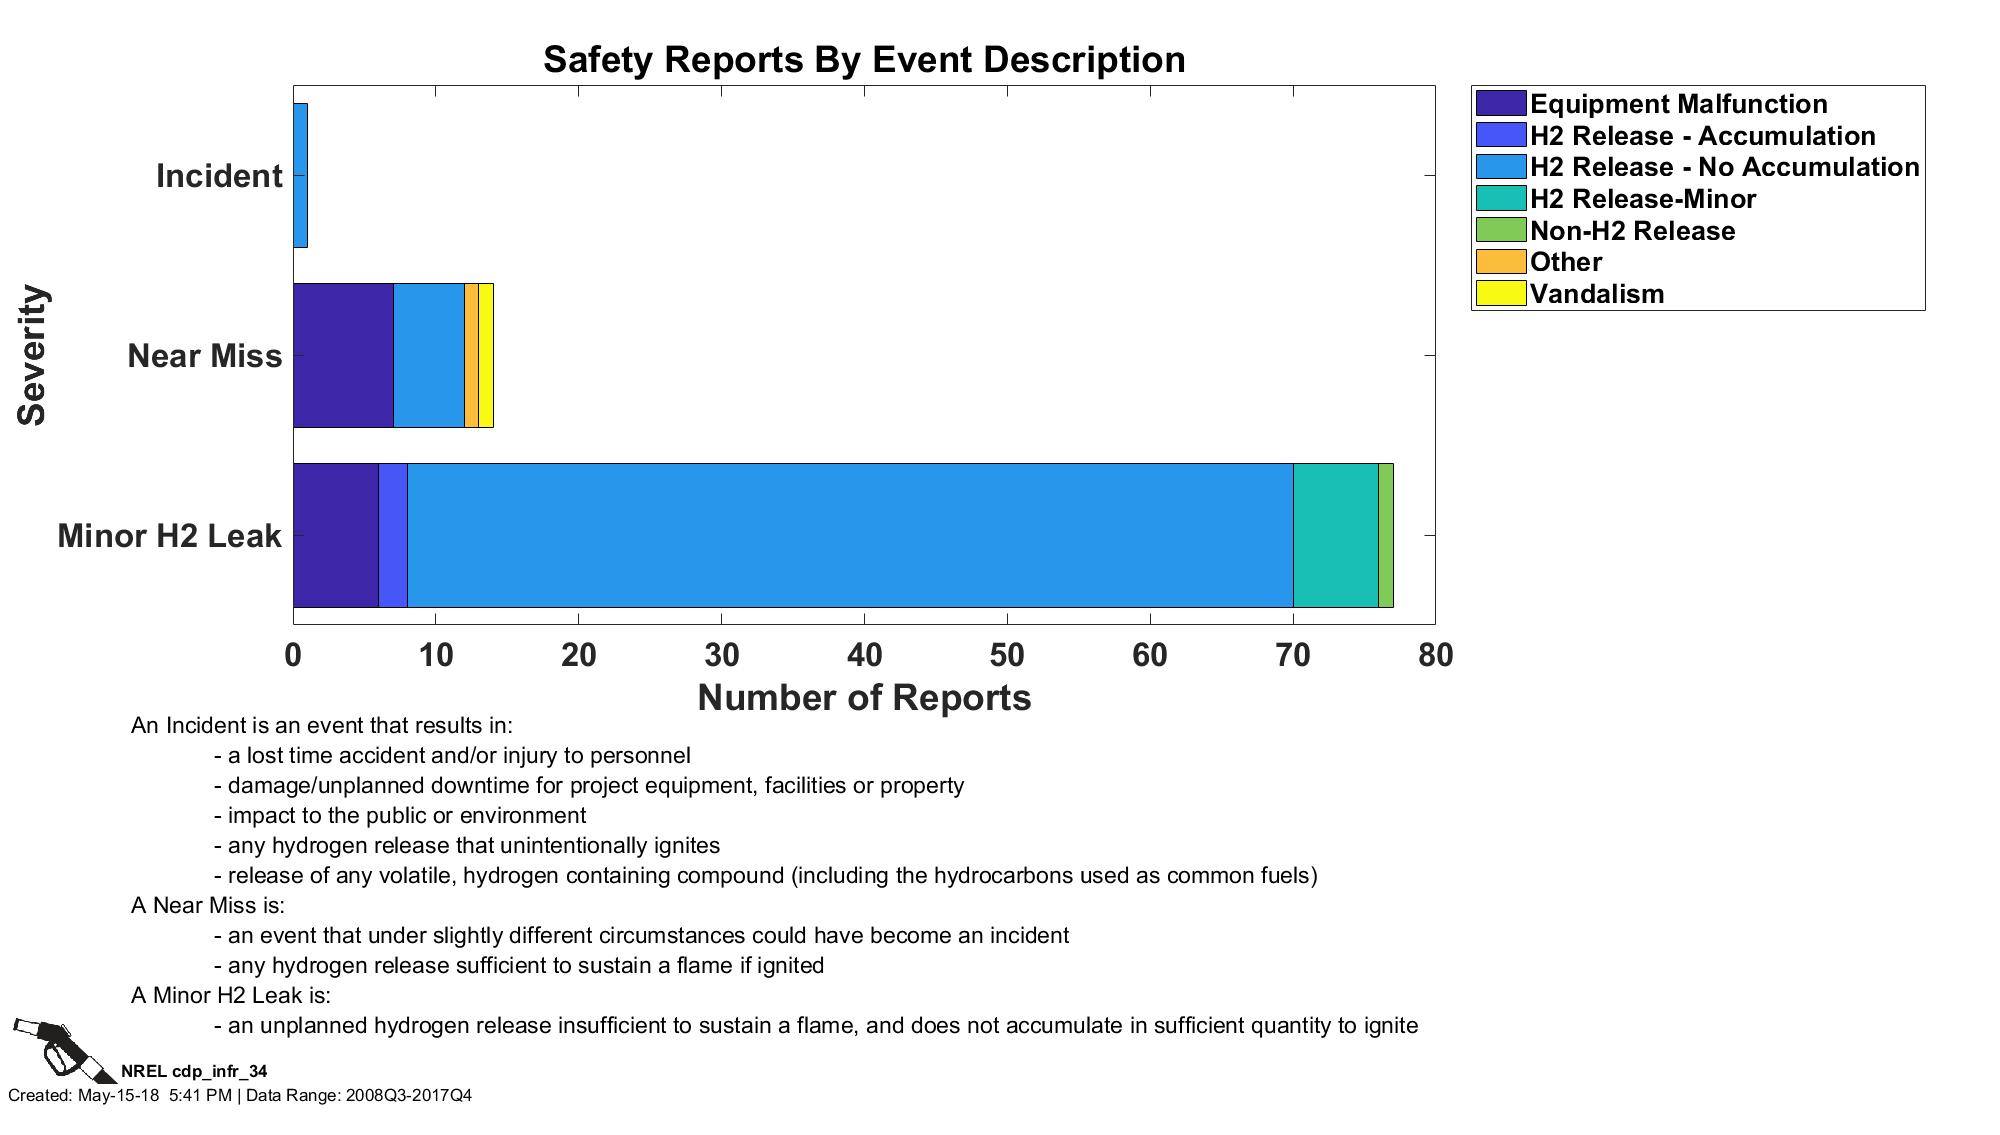
Safety Reports by Event Description
CDP INFR 34, 5/15/18
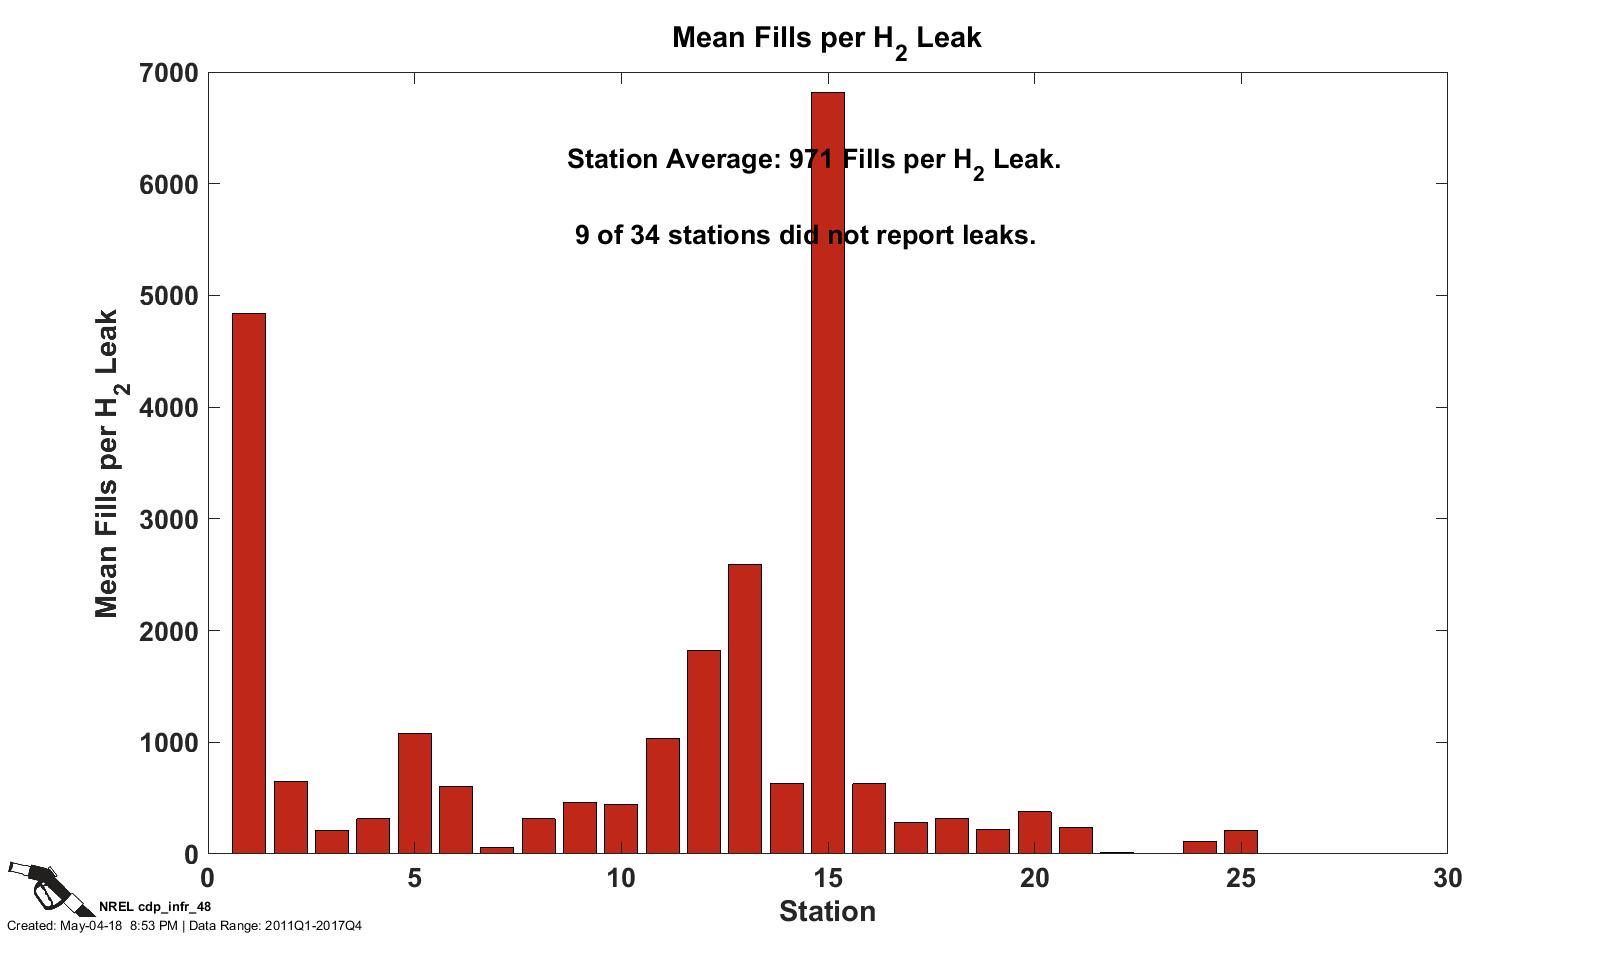
Mean Fills per Hydrogen Leak
CDP INFR 48, 5/4/18
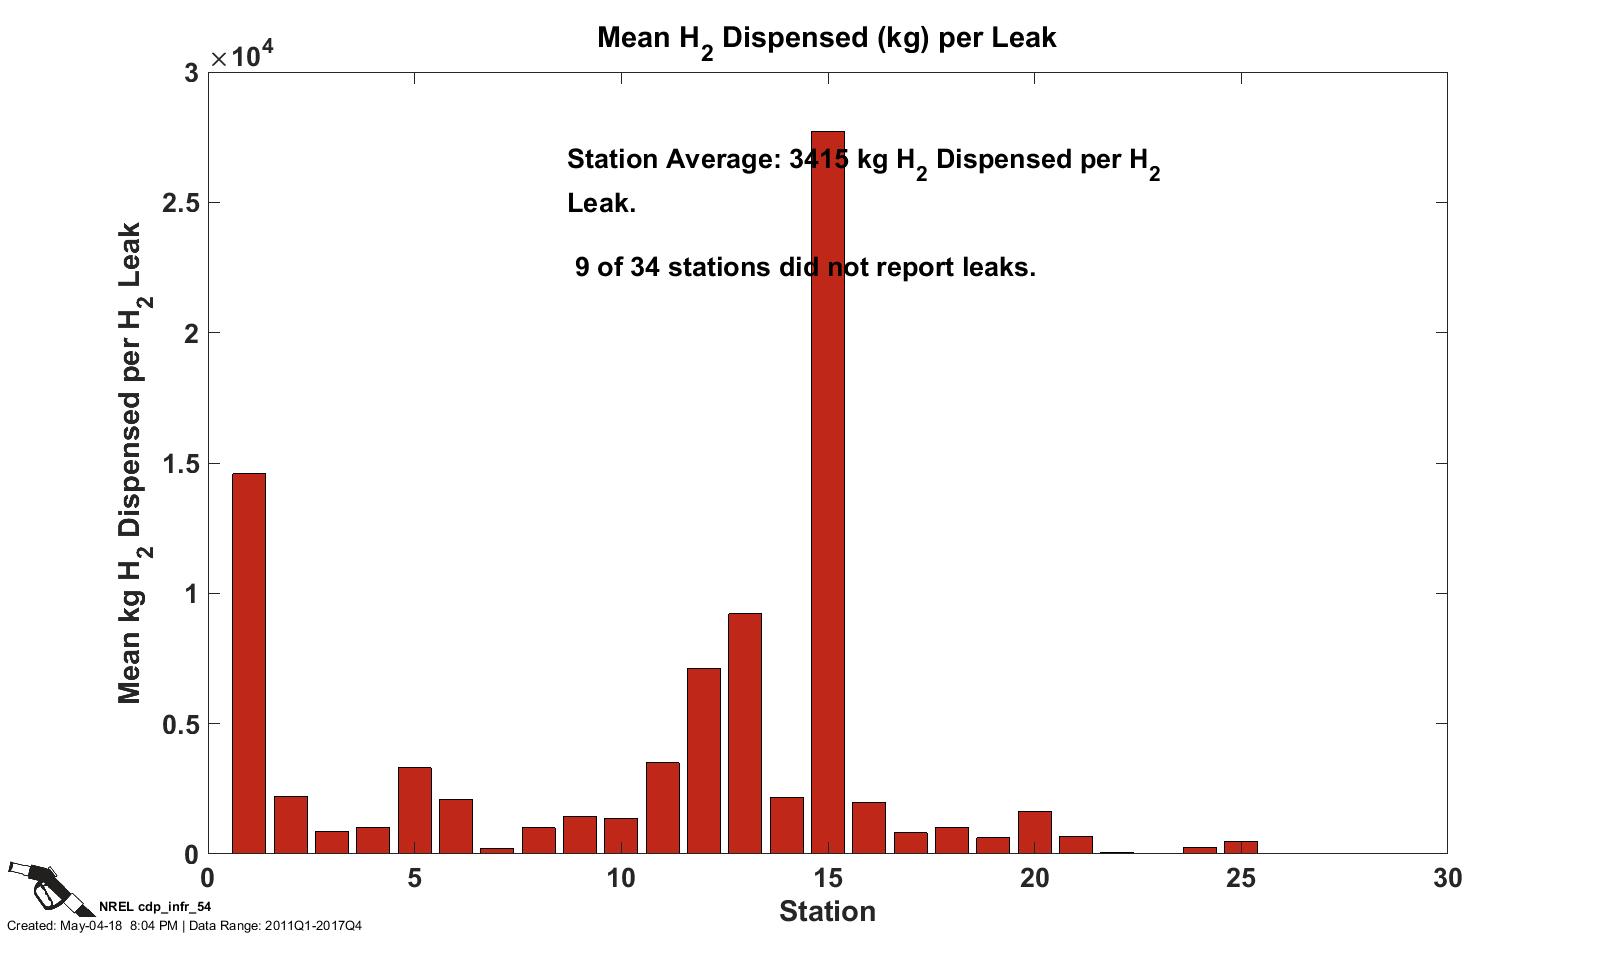
Mean Hydrogen Dispensed per Hydrogen Leak
CDP INFR 54, 5/4/18
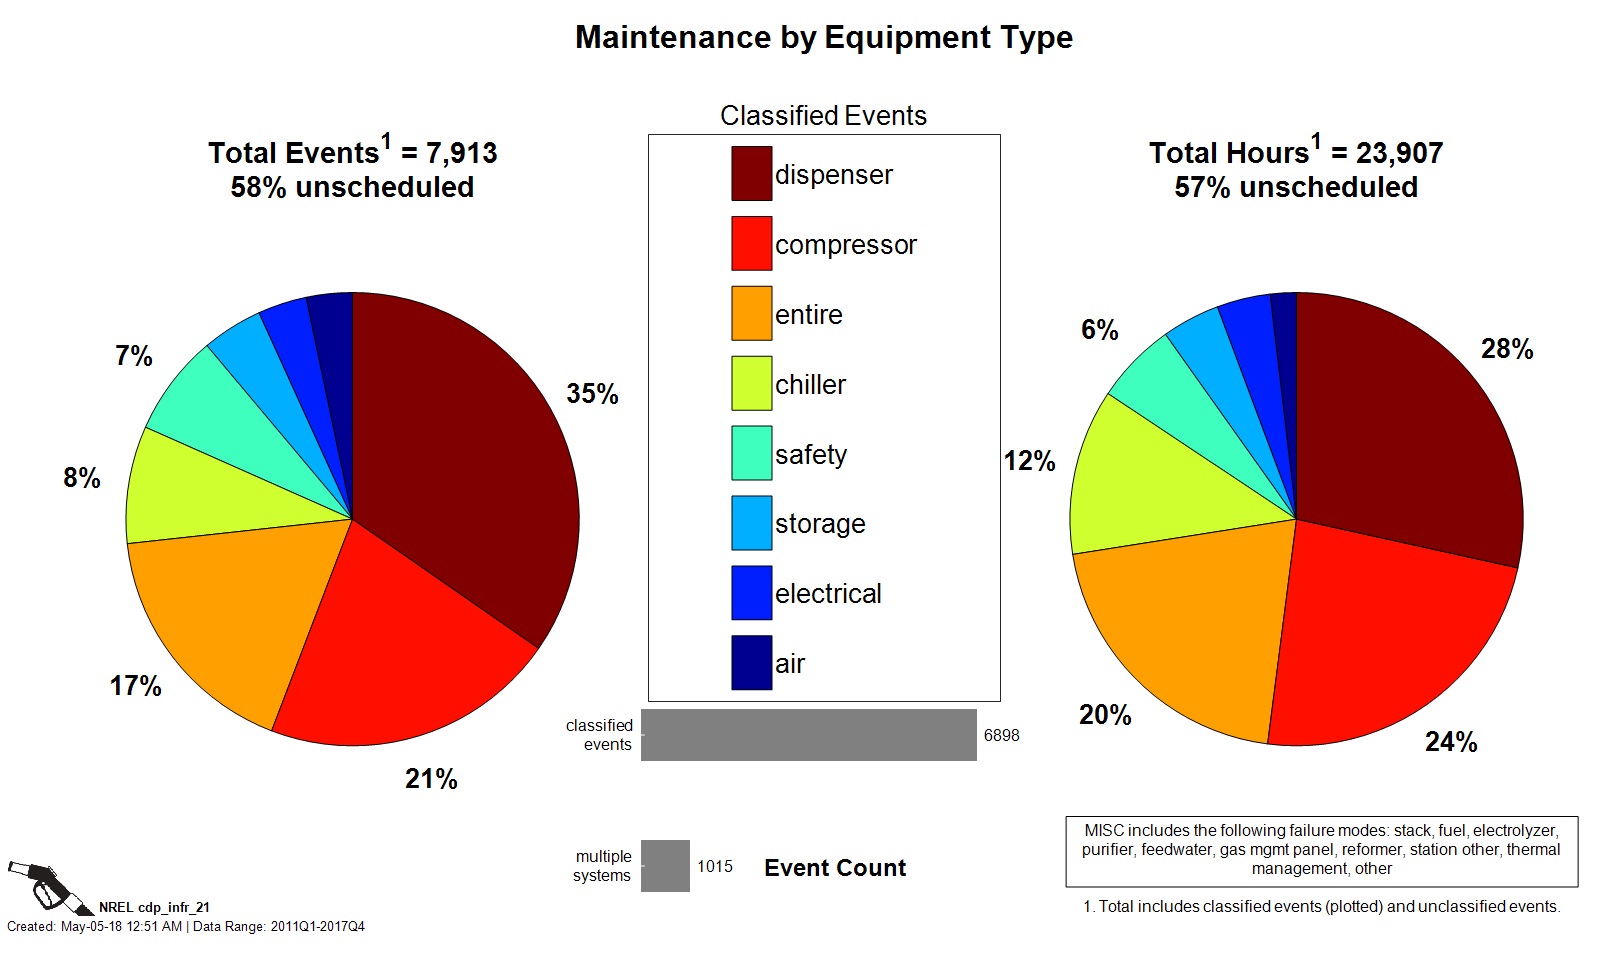
Maintenance by Equipment Type
CDP INFR 21, 5/5/18
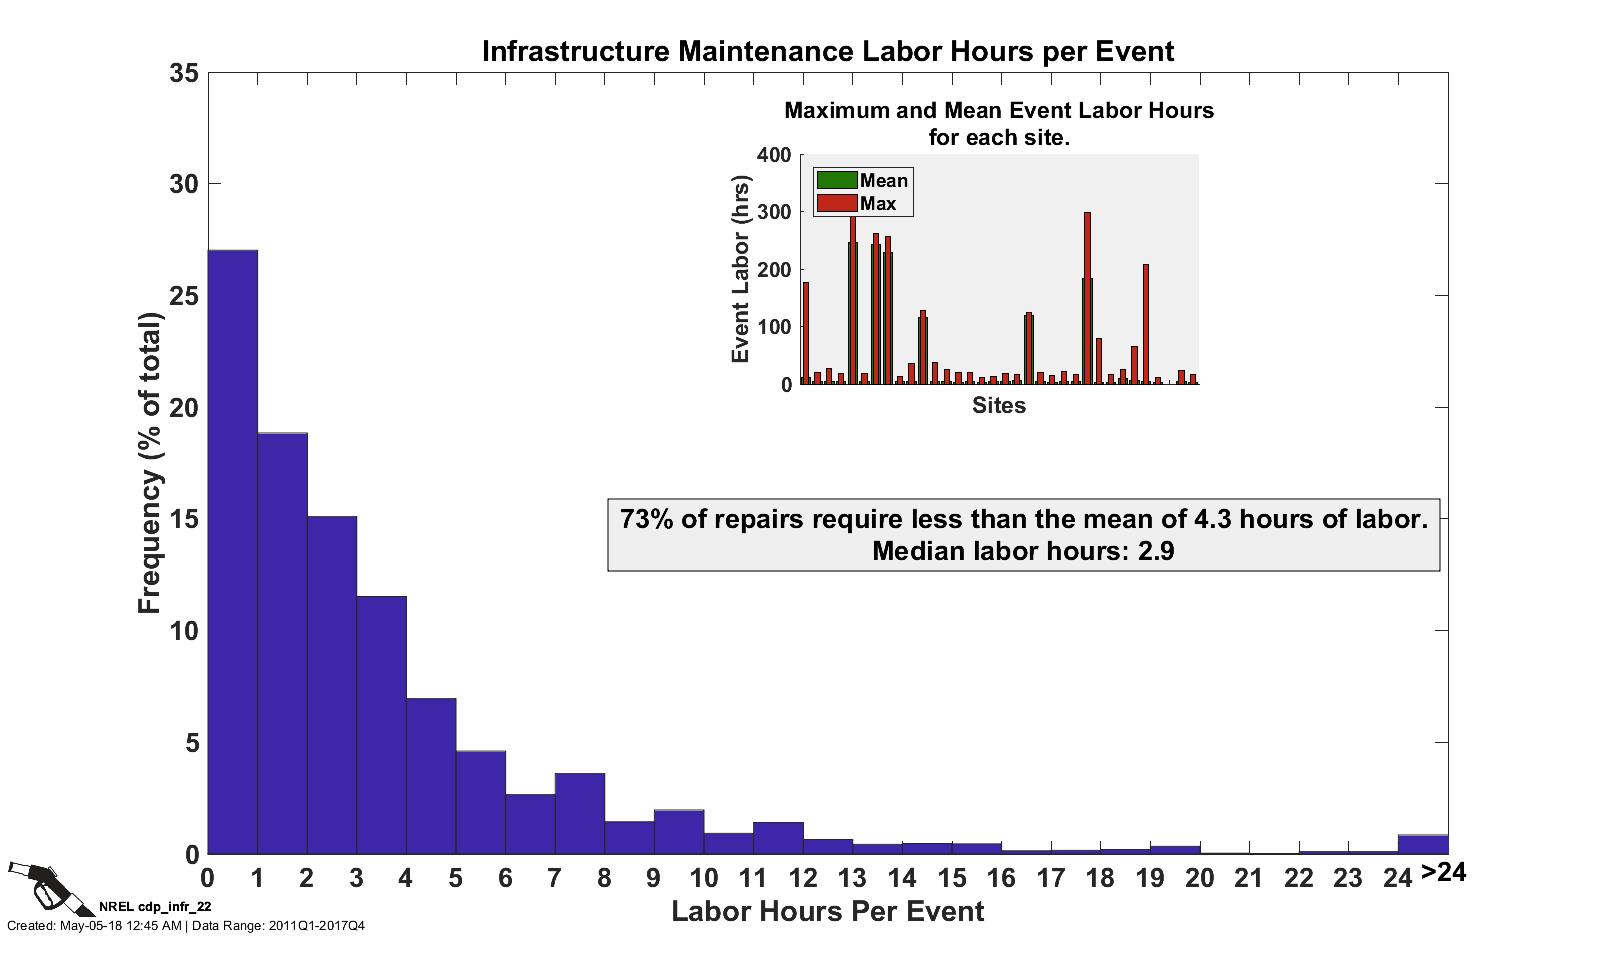
Maintenance Labor Hours per Event
CDP INFR 22, 5/5/18
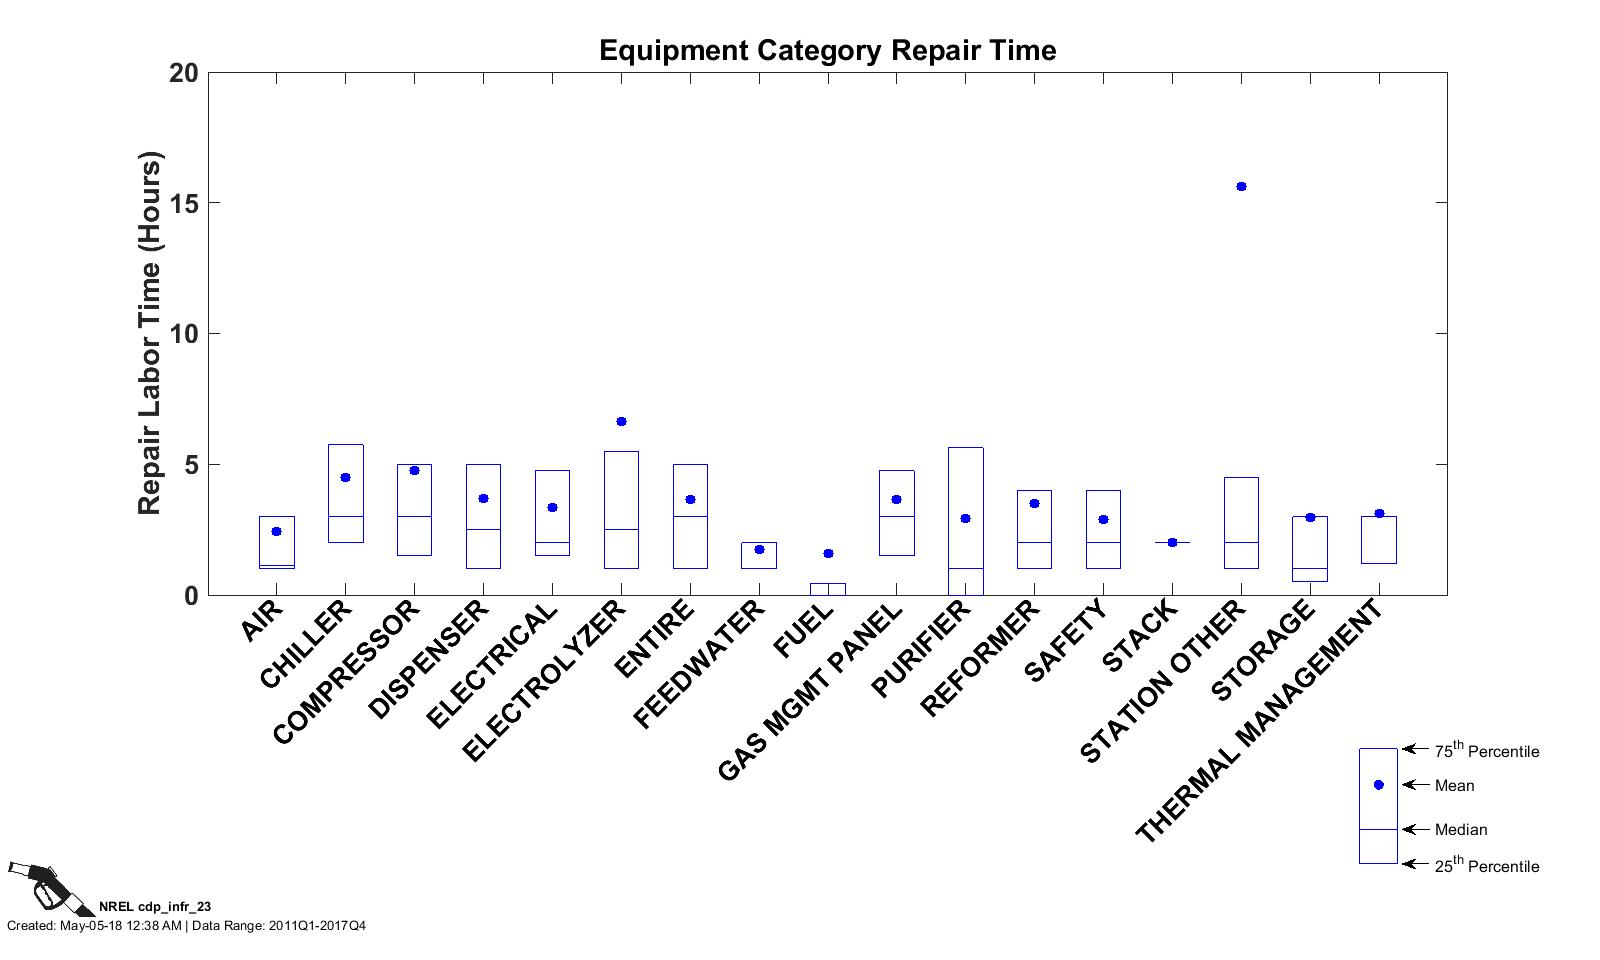
Equipment Category Repair Time
CDP INFR 23, 5/5/18
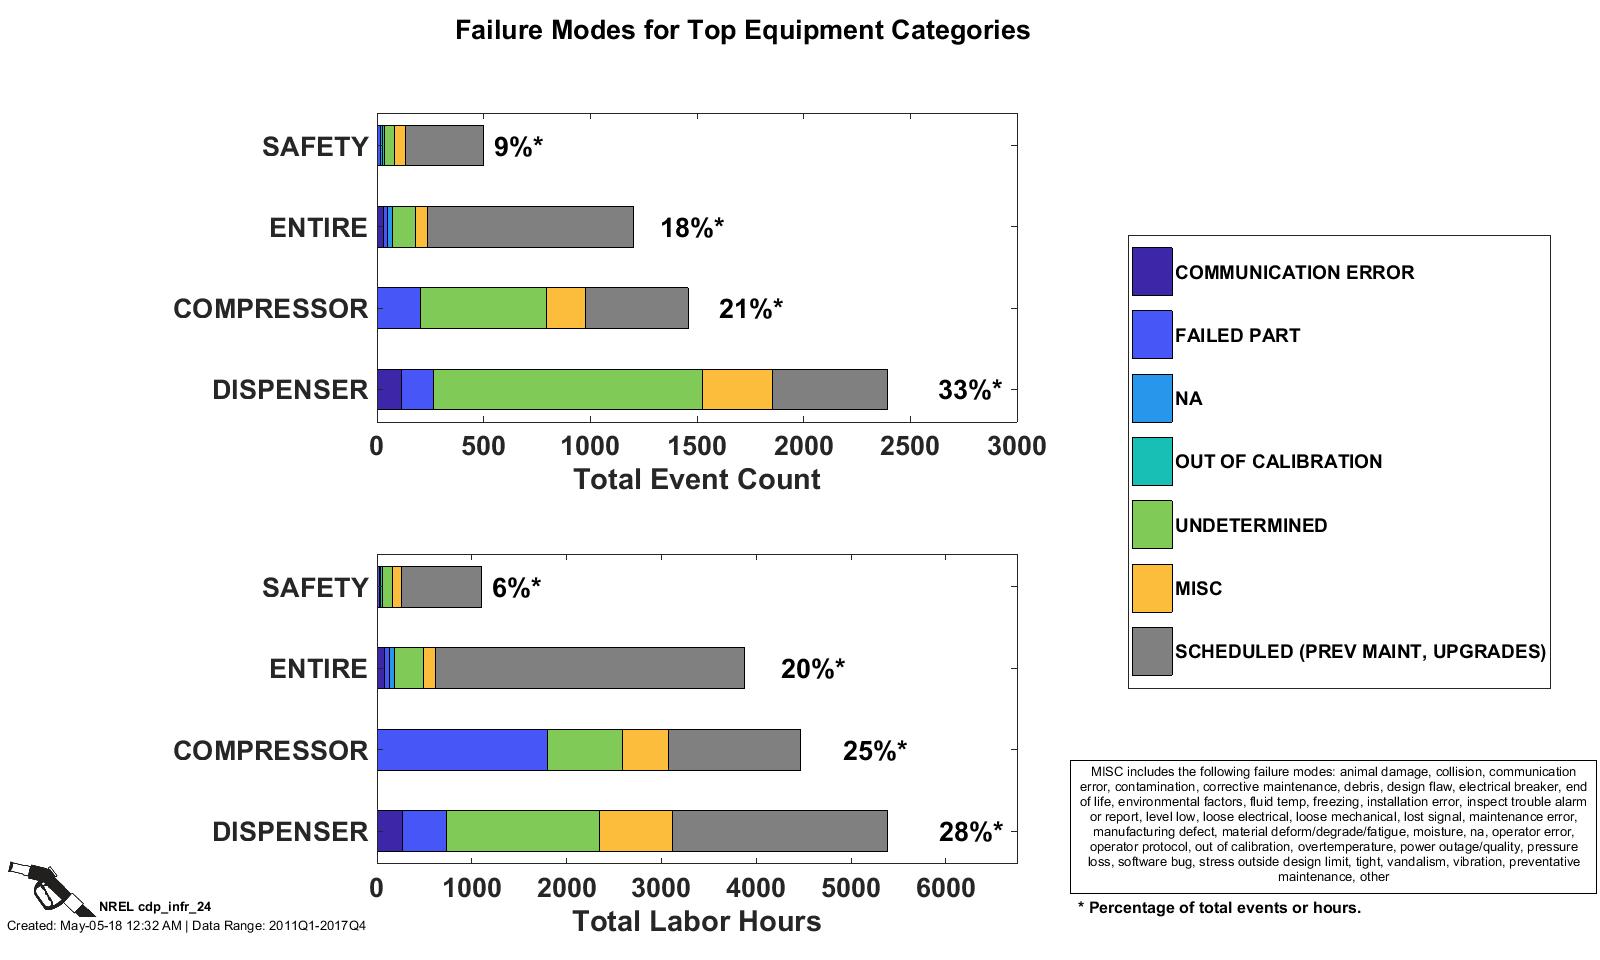
Failure Modes for Top Equipment Categories
CDP INFR 24, 5/5/18
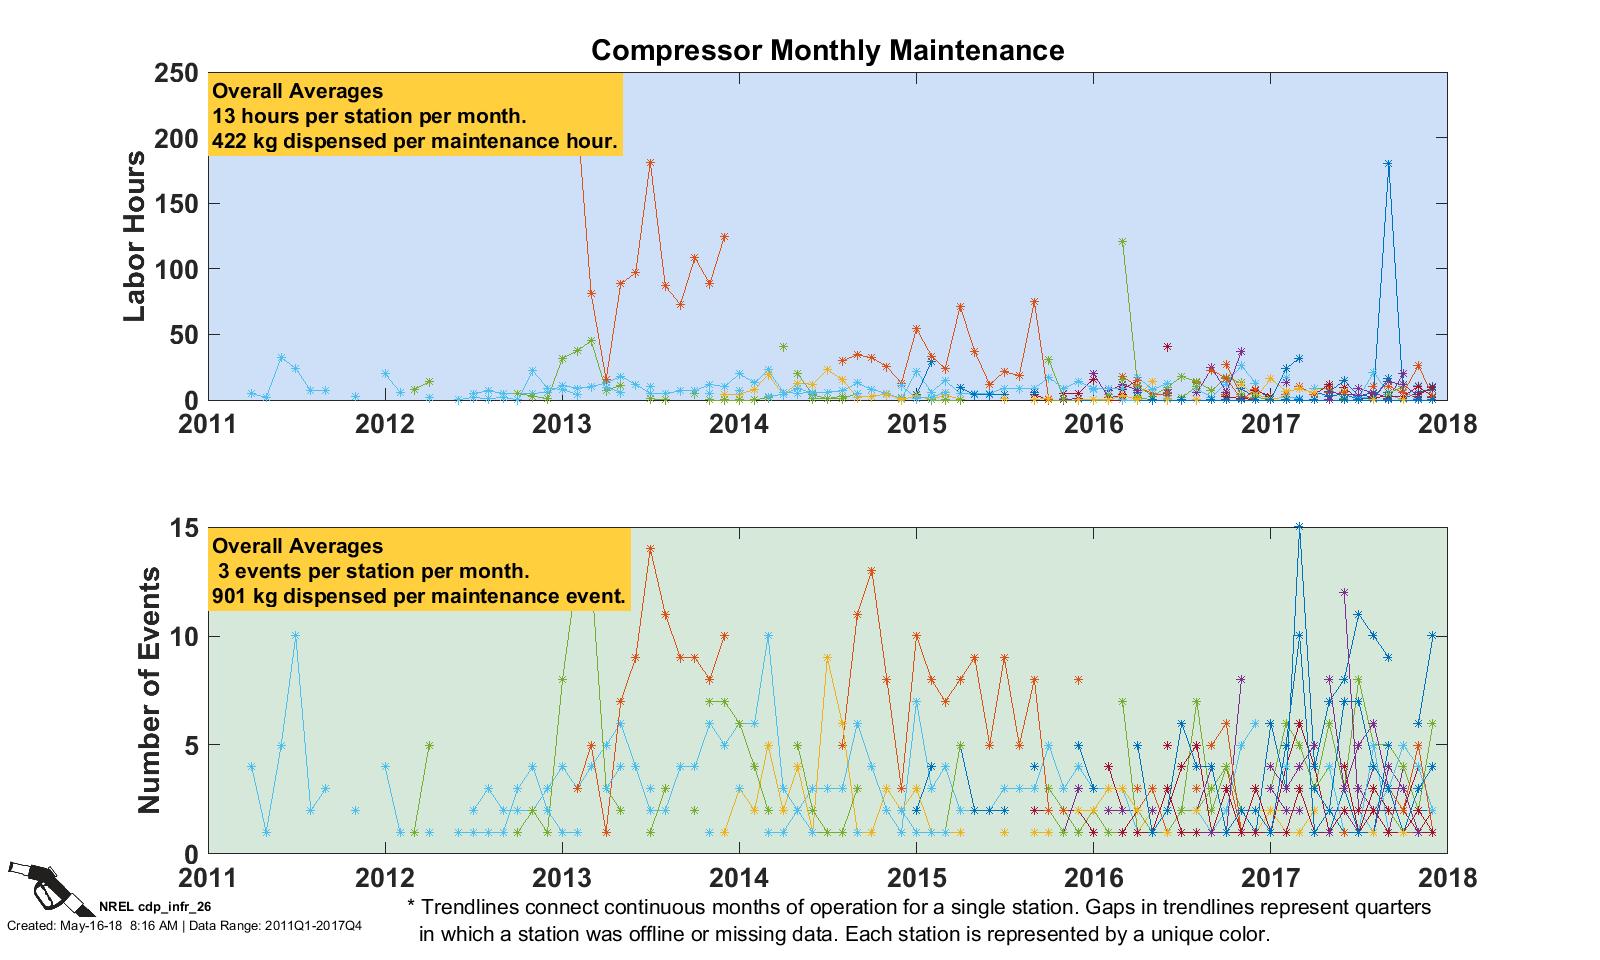
Compressor Monthly Maintenance
CDP INFR 26, 5/16/18
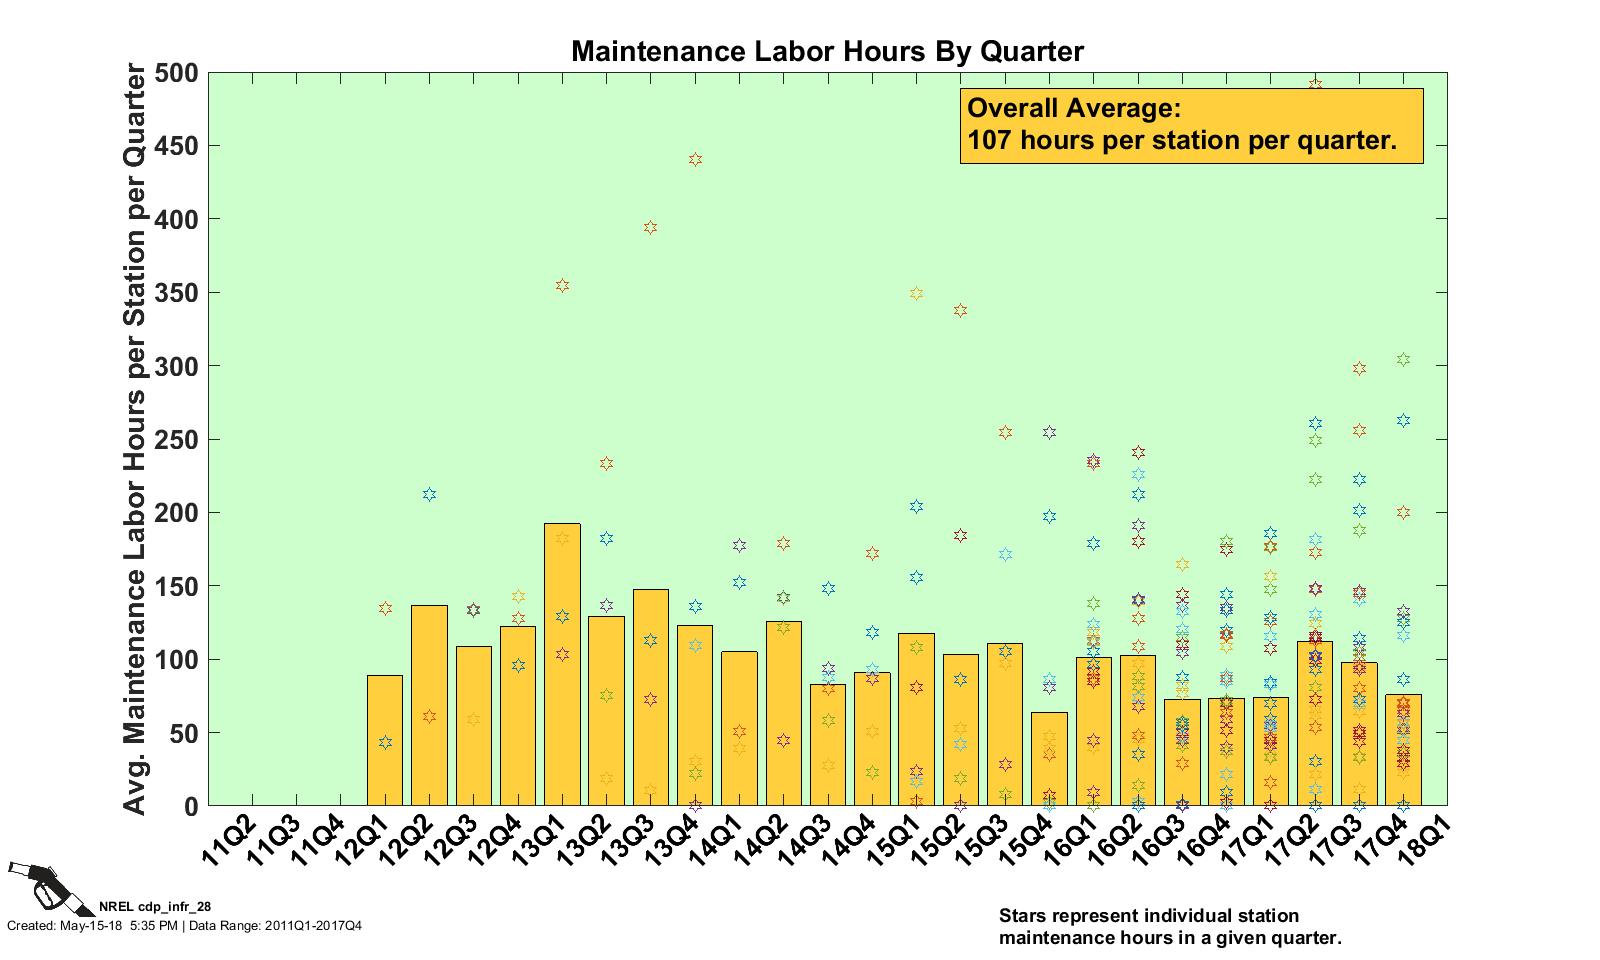
Maintenance Labor Hours by Quarter
CDP INFR 28, 5/15/18
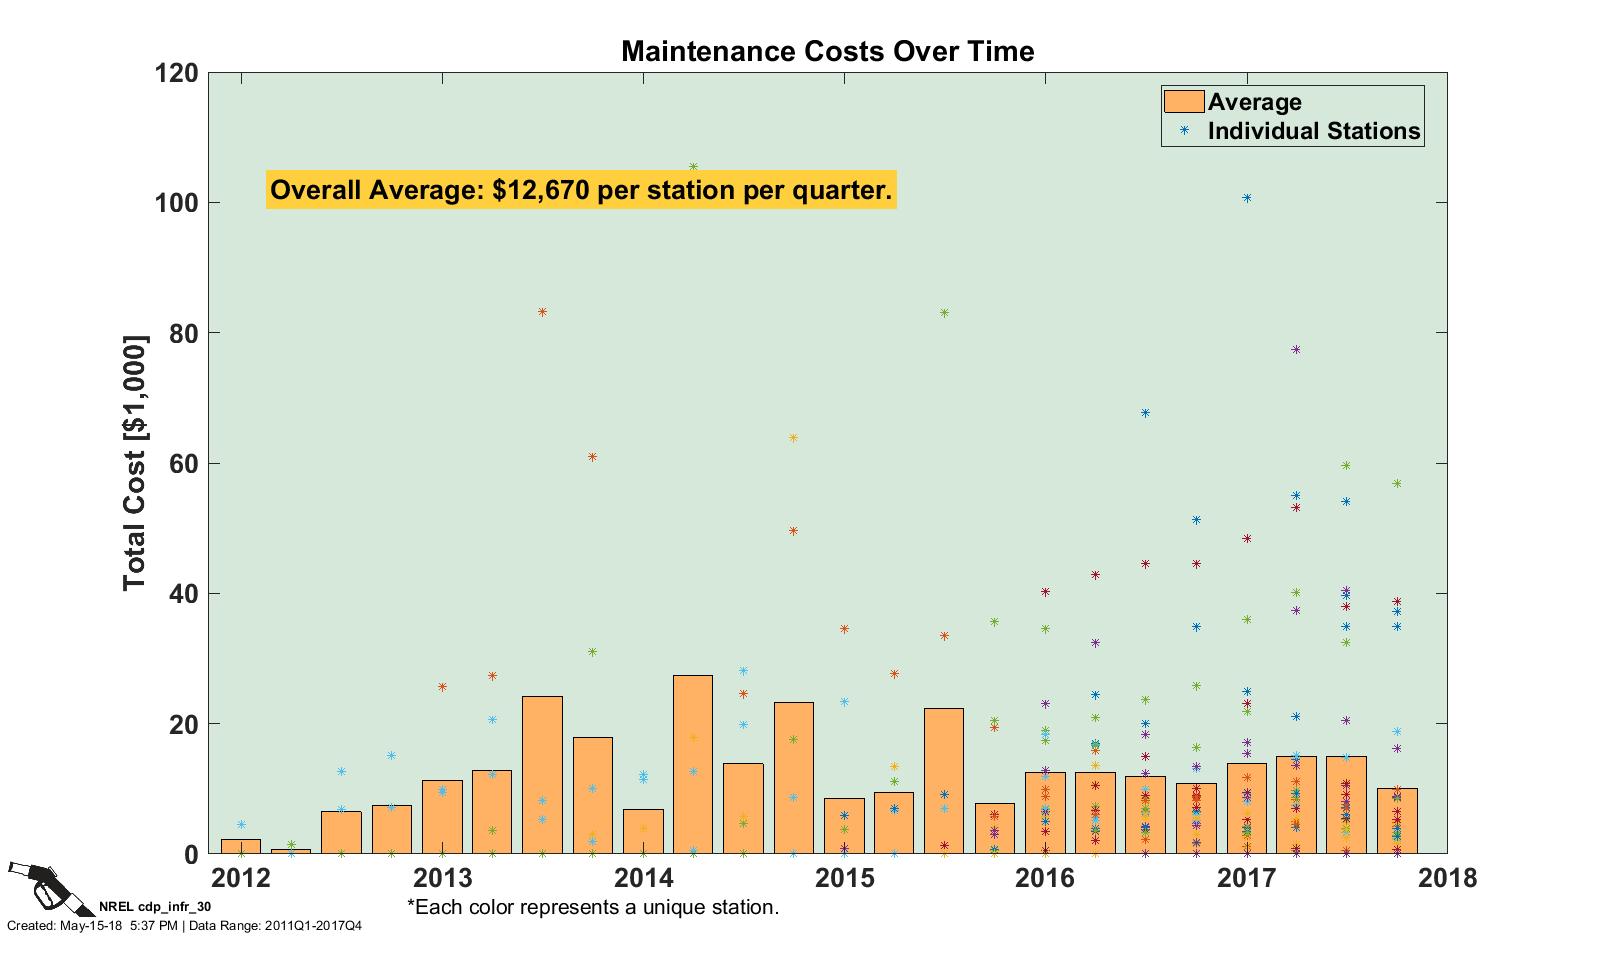
Maintenance Costs Over Time
CDP INFR 30, 5/15/18
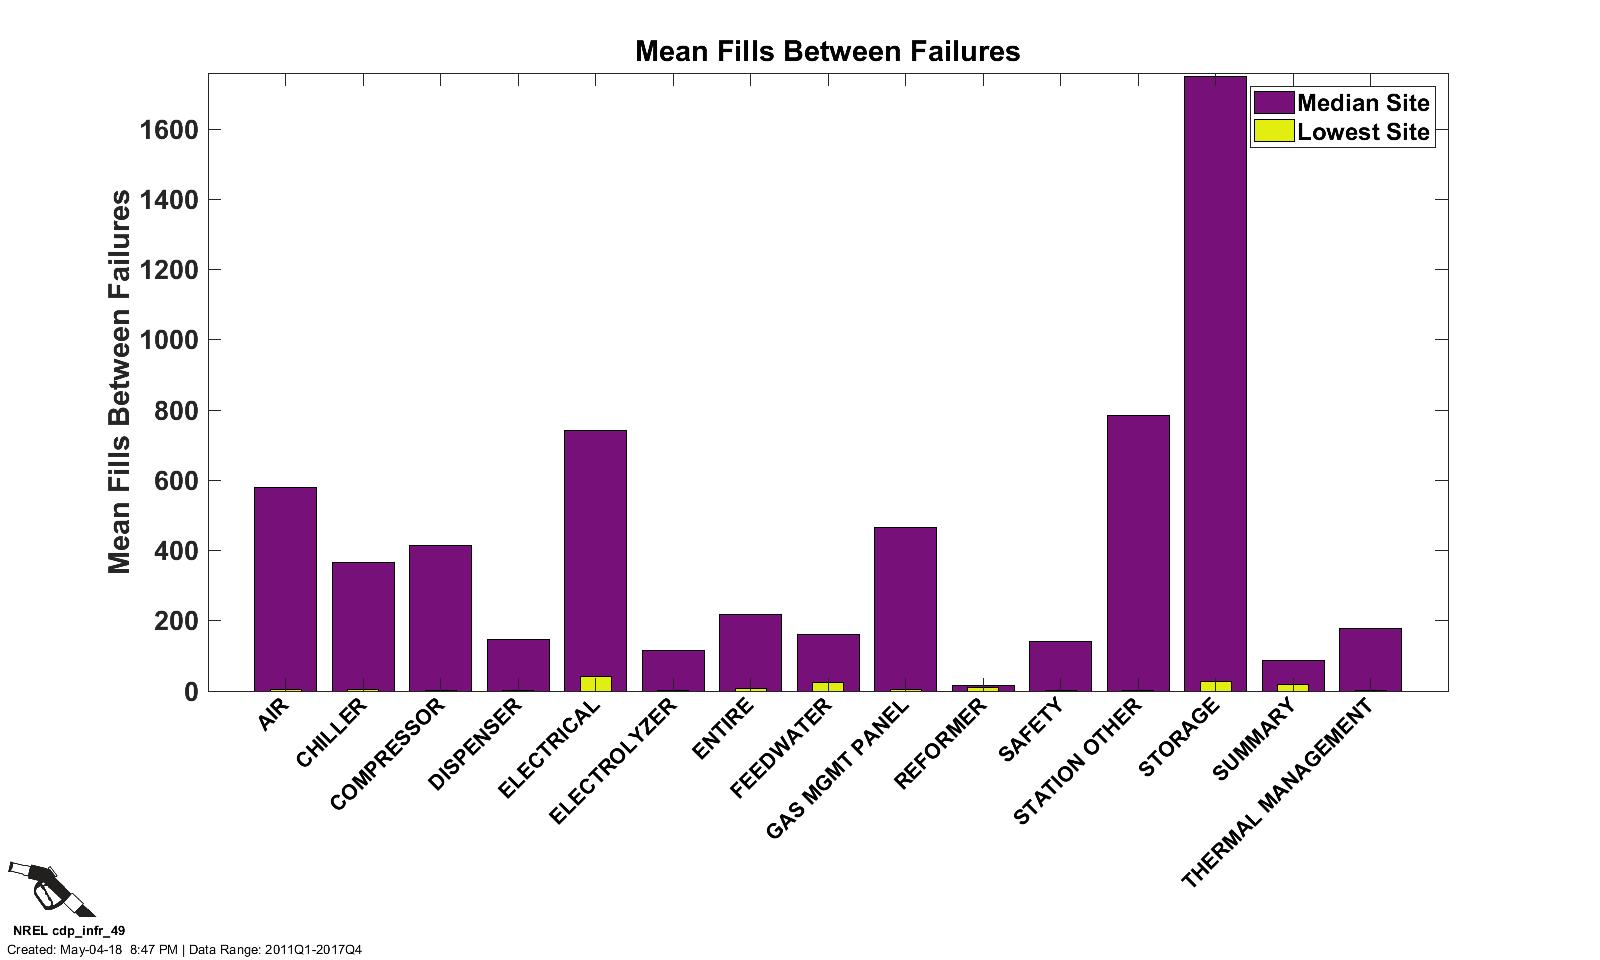
Mean Fills Between Failures
CDP INFR 49, 5/4/18
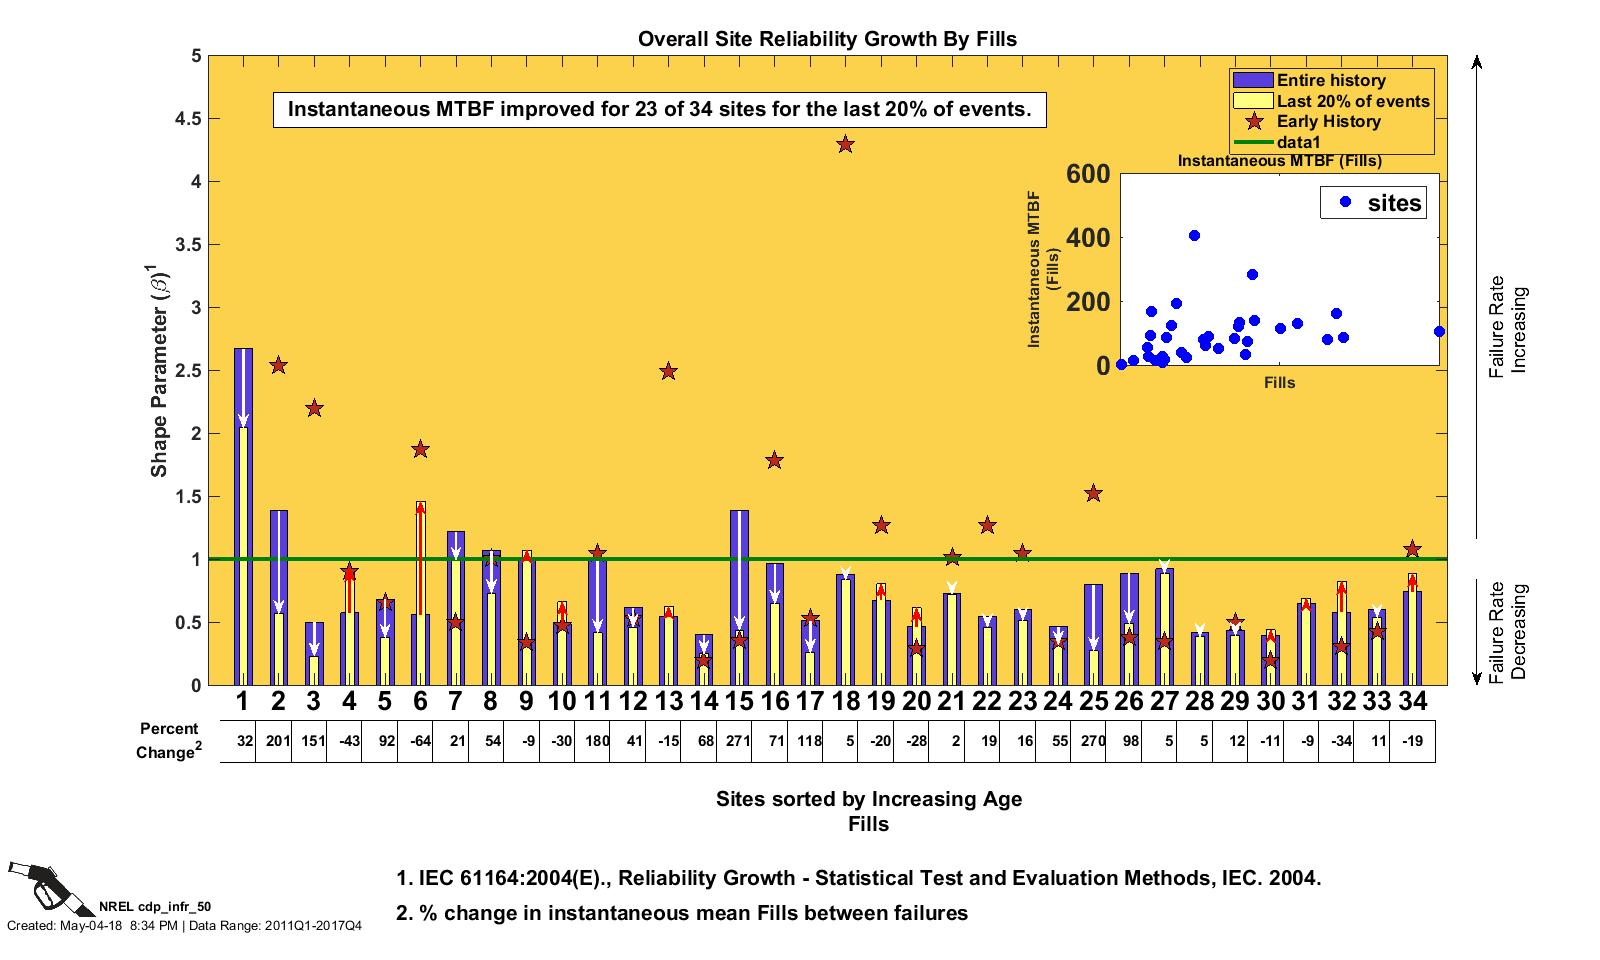
Reliability Growth by Fills
CDP INFR 50, 5/4/18
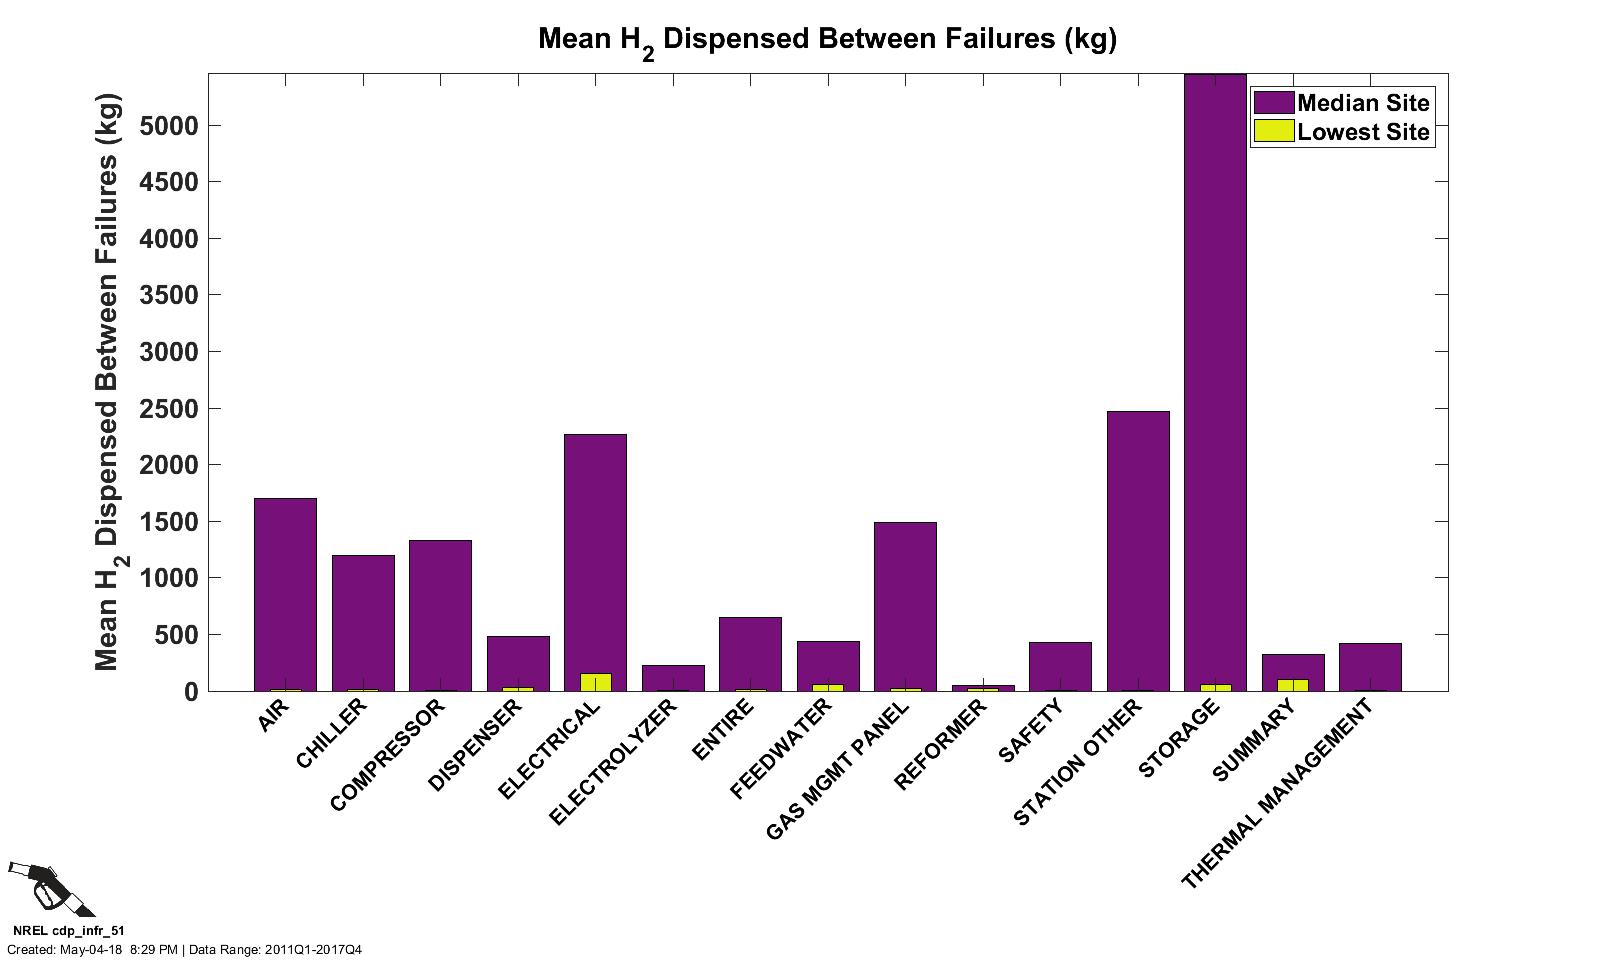
Mean Amount Dispensed Between Failures
CDP INFR 51, 5/4/18
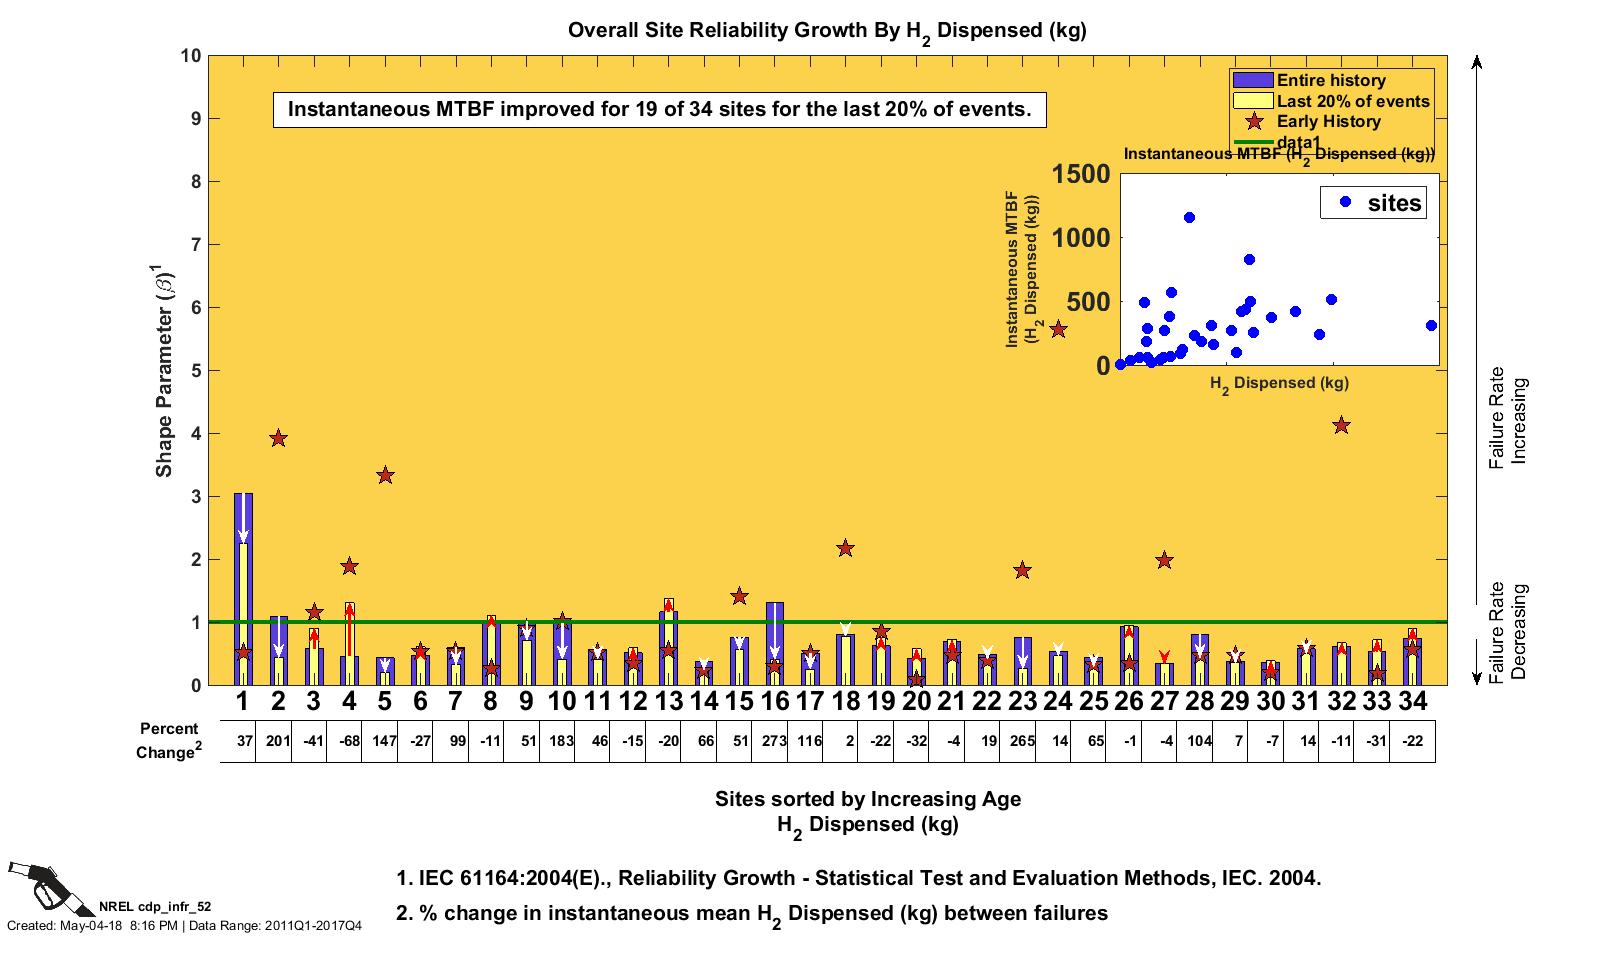
Reliability Growth by Amount Dispensed
CDP INFR 52, 5/4/18
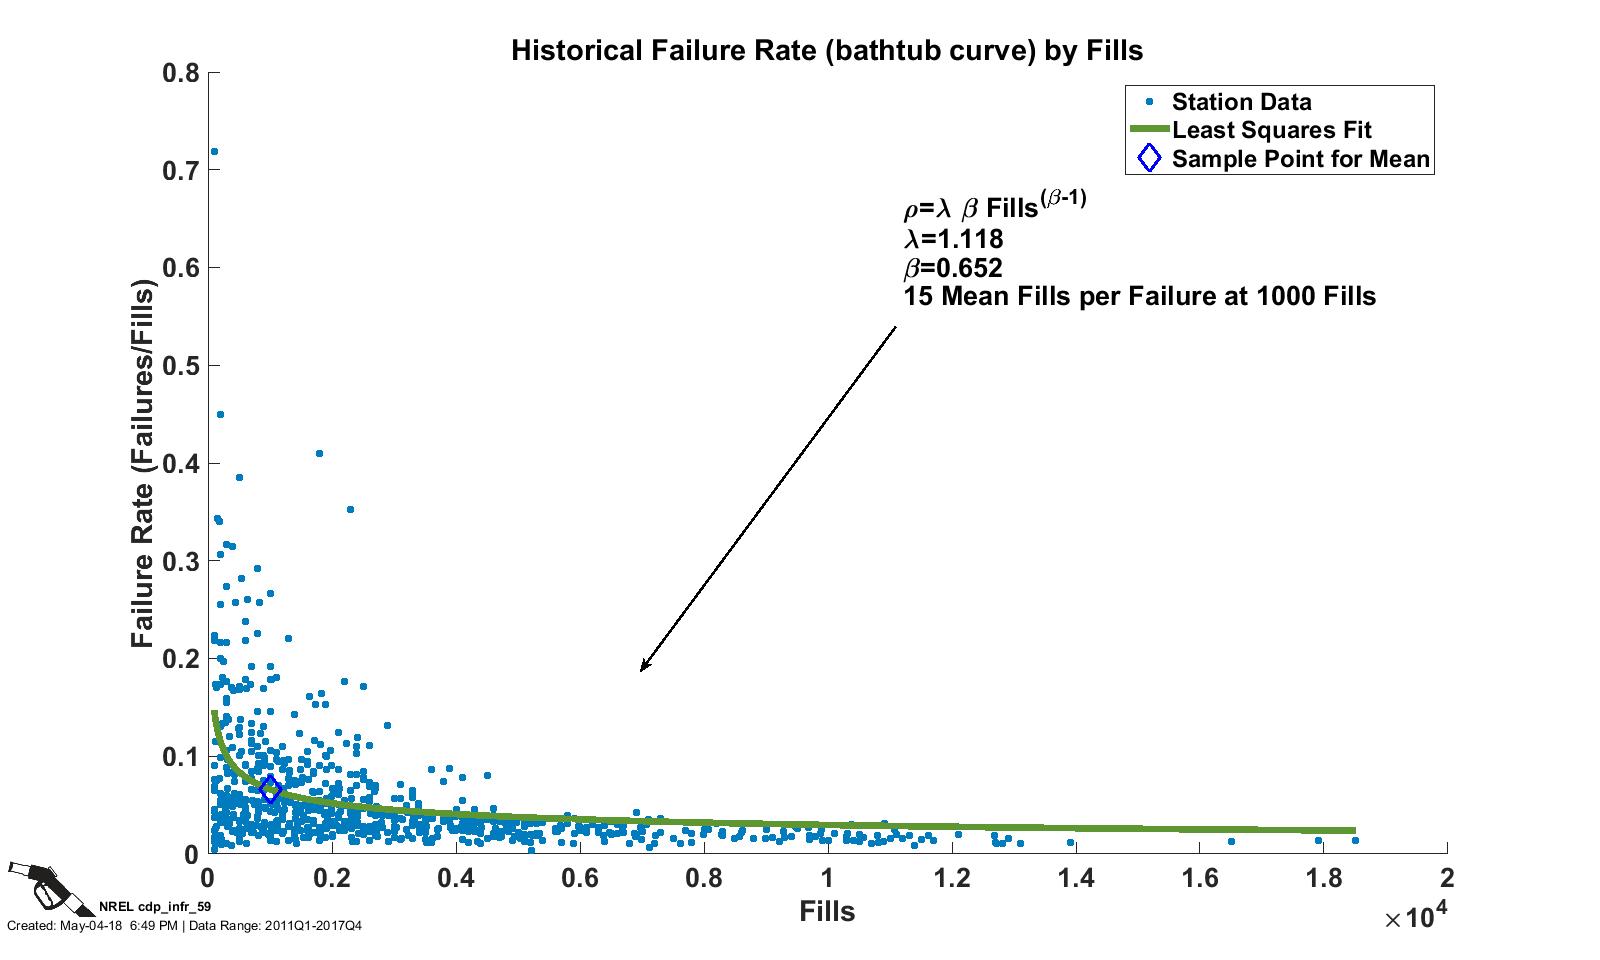
Historical Failure Rate by Fills
CDP INFR 59, 5/4/18
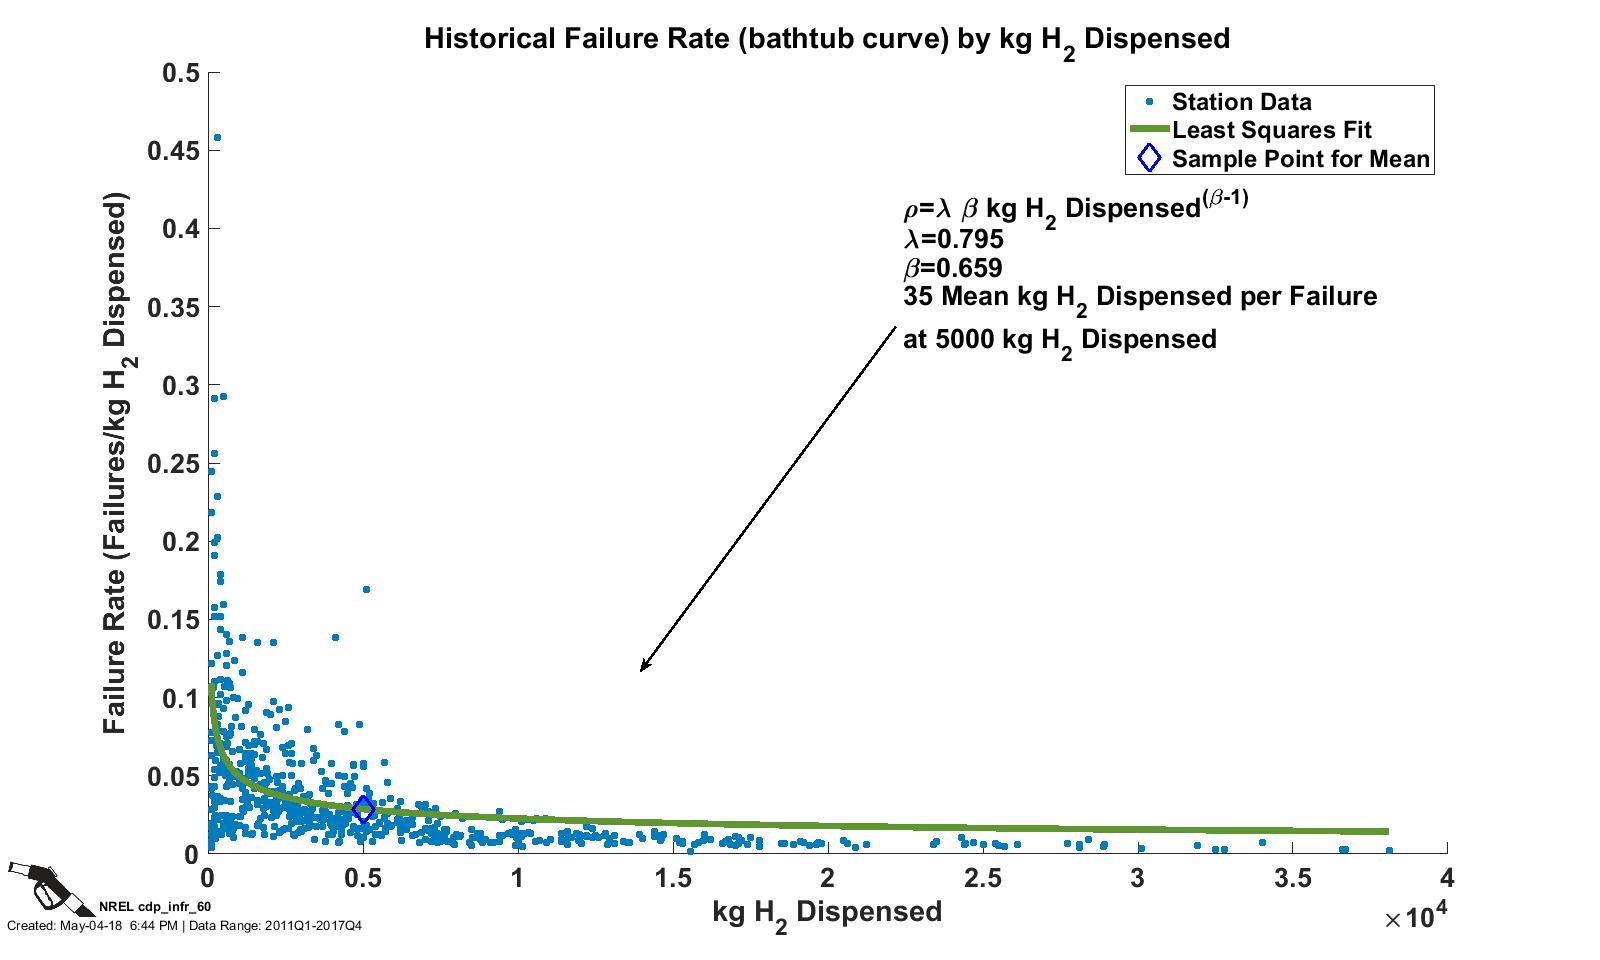
Historical Failure Rate by Amount Dispensed
CDP INFR 60, 5/4/18
Mean Fills per Hydrogen Leak Over Time
CDP INFR 62, 10/27/17
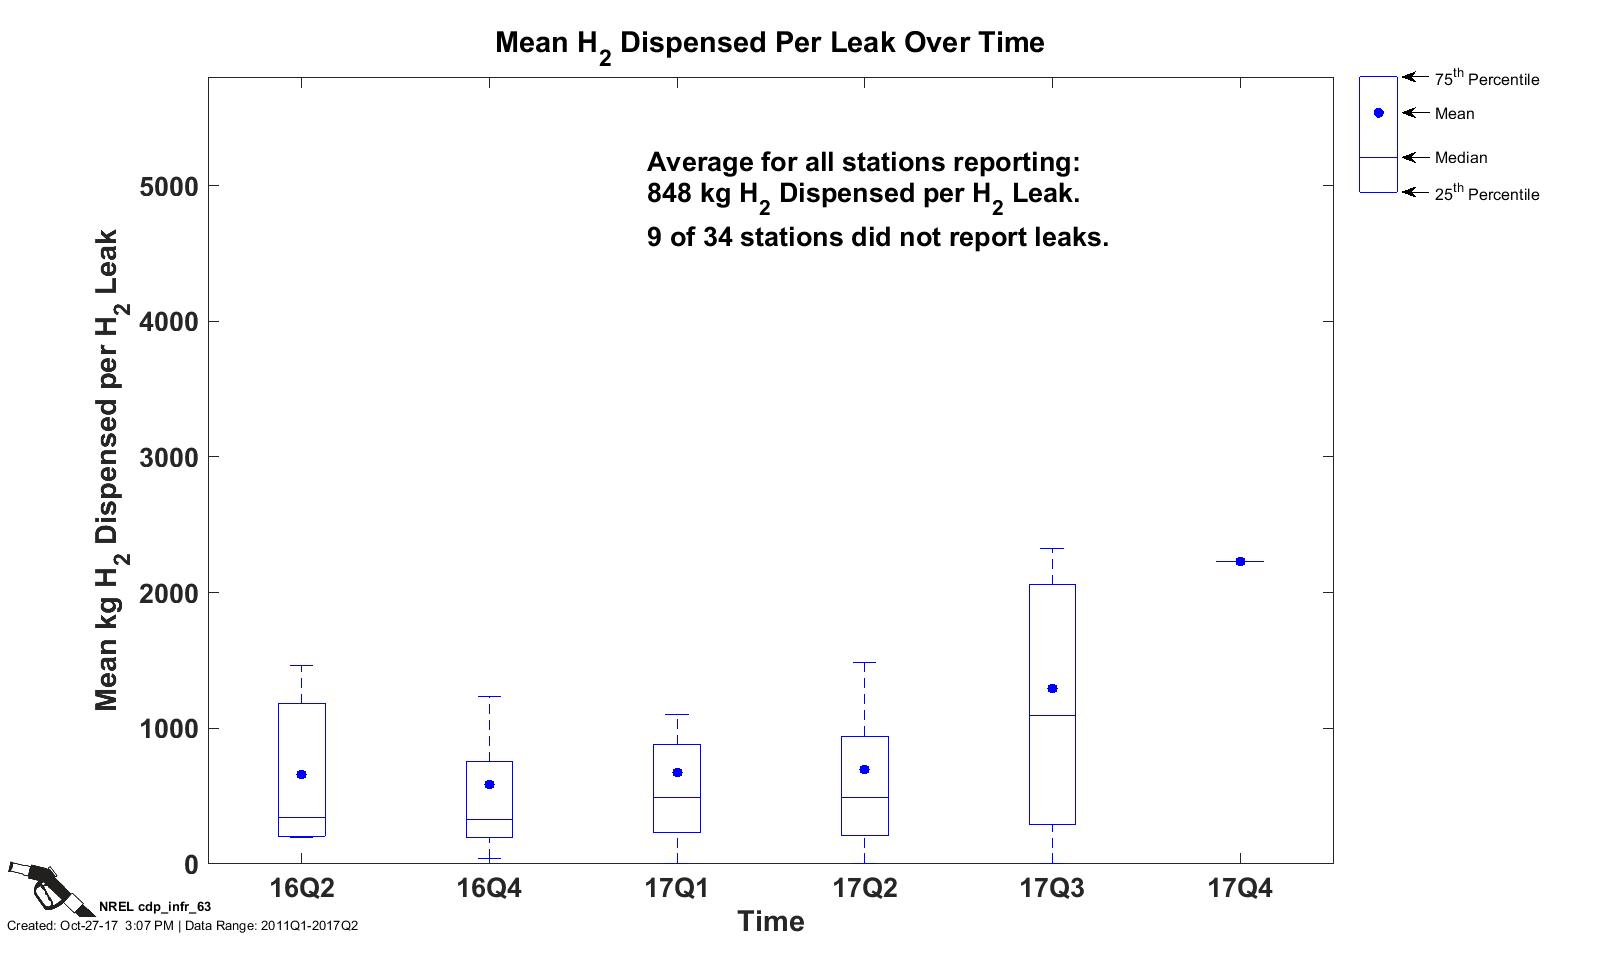
Mean Hydrogen Dispensed per Leak Over Time
CDP INFR 63, 10/27/17
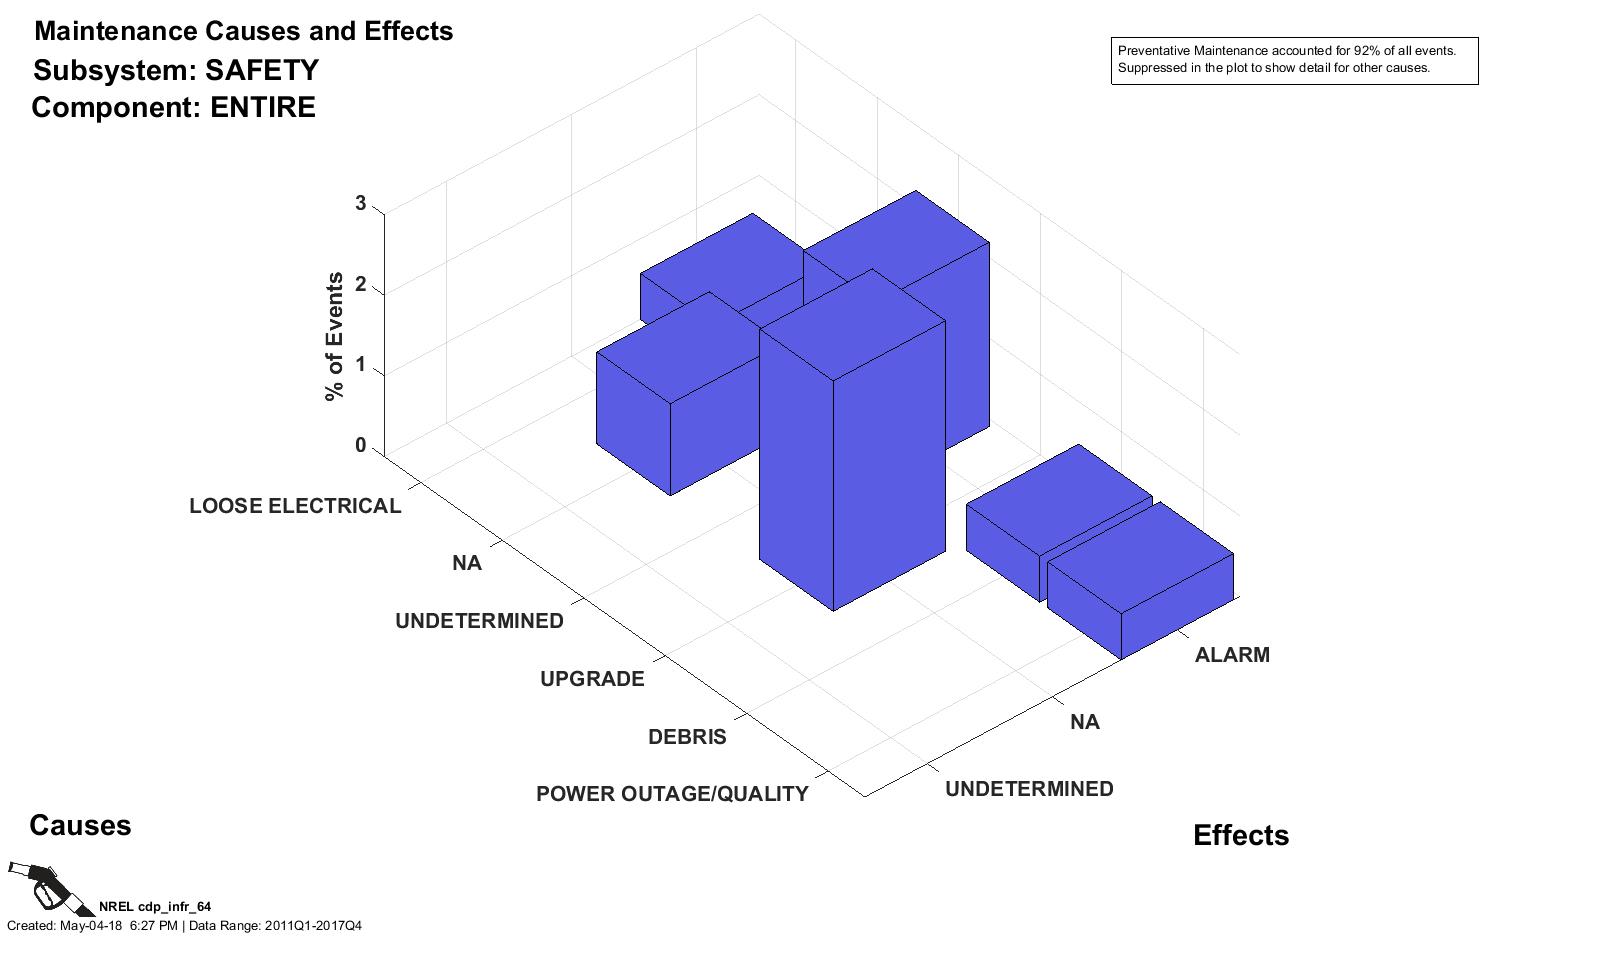
Maintenance Causes and Effects: Safety (Entire)
CDP INFR 64, 5/4/18
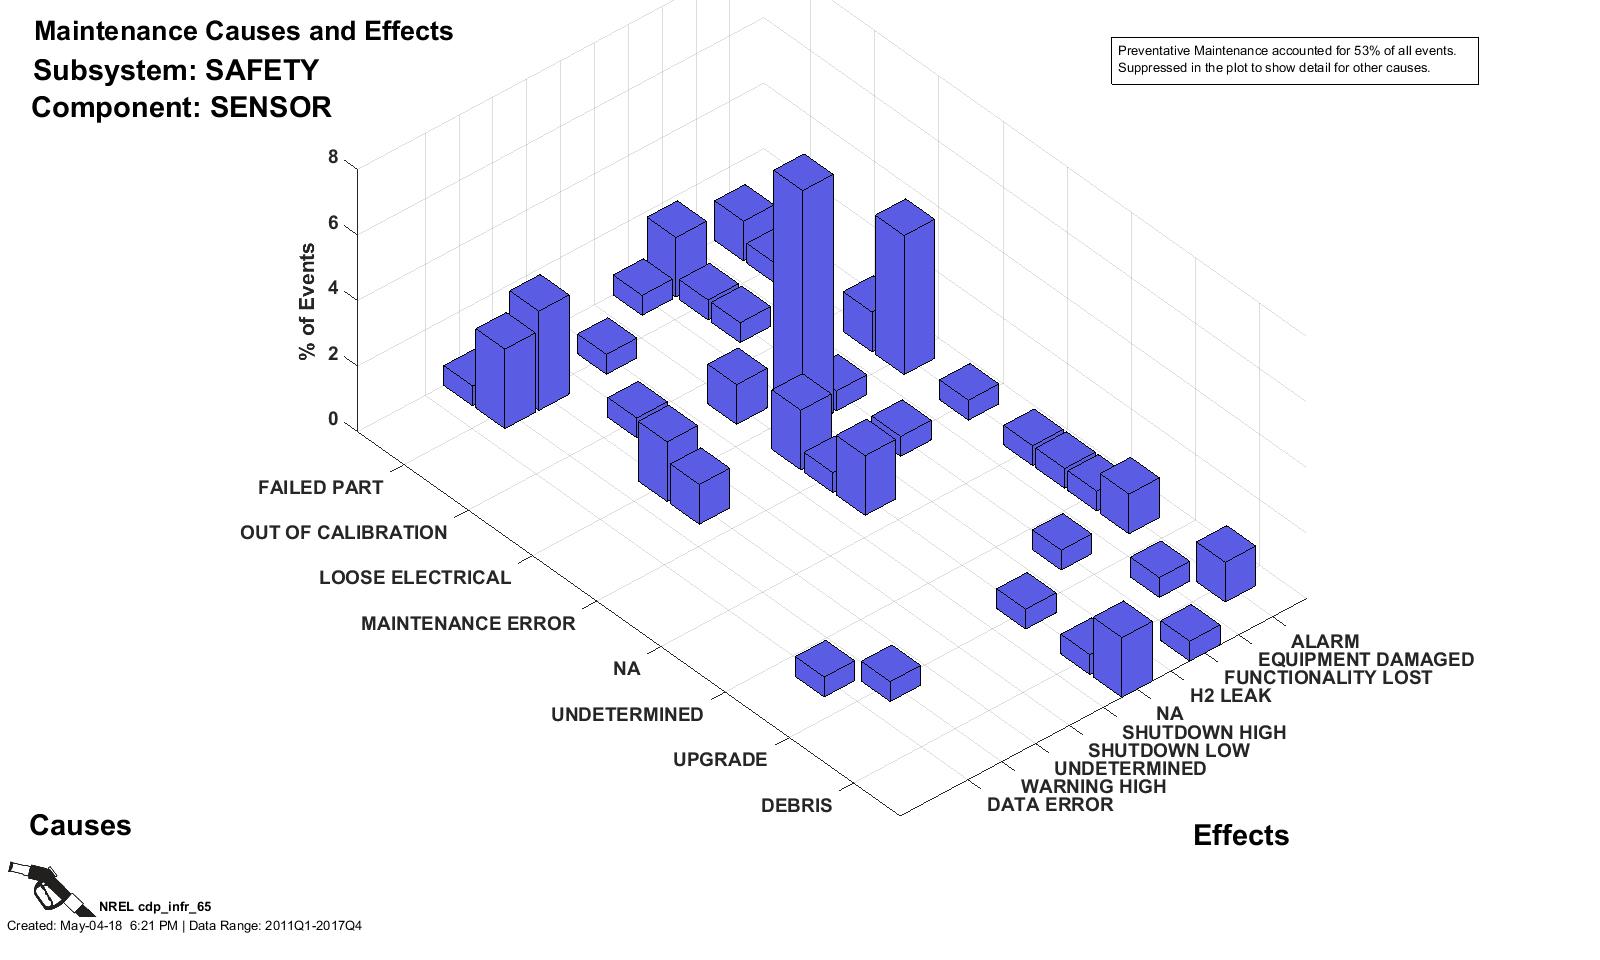
Maintenance Causes and Effects: Safety (Sensor)
CDP INFR 65, 5/4/18
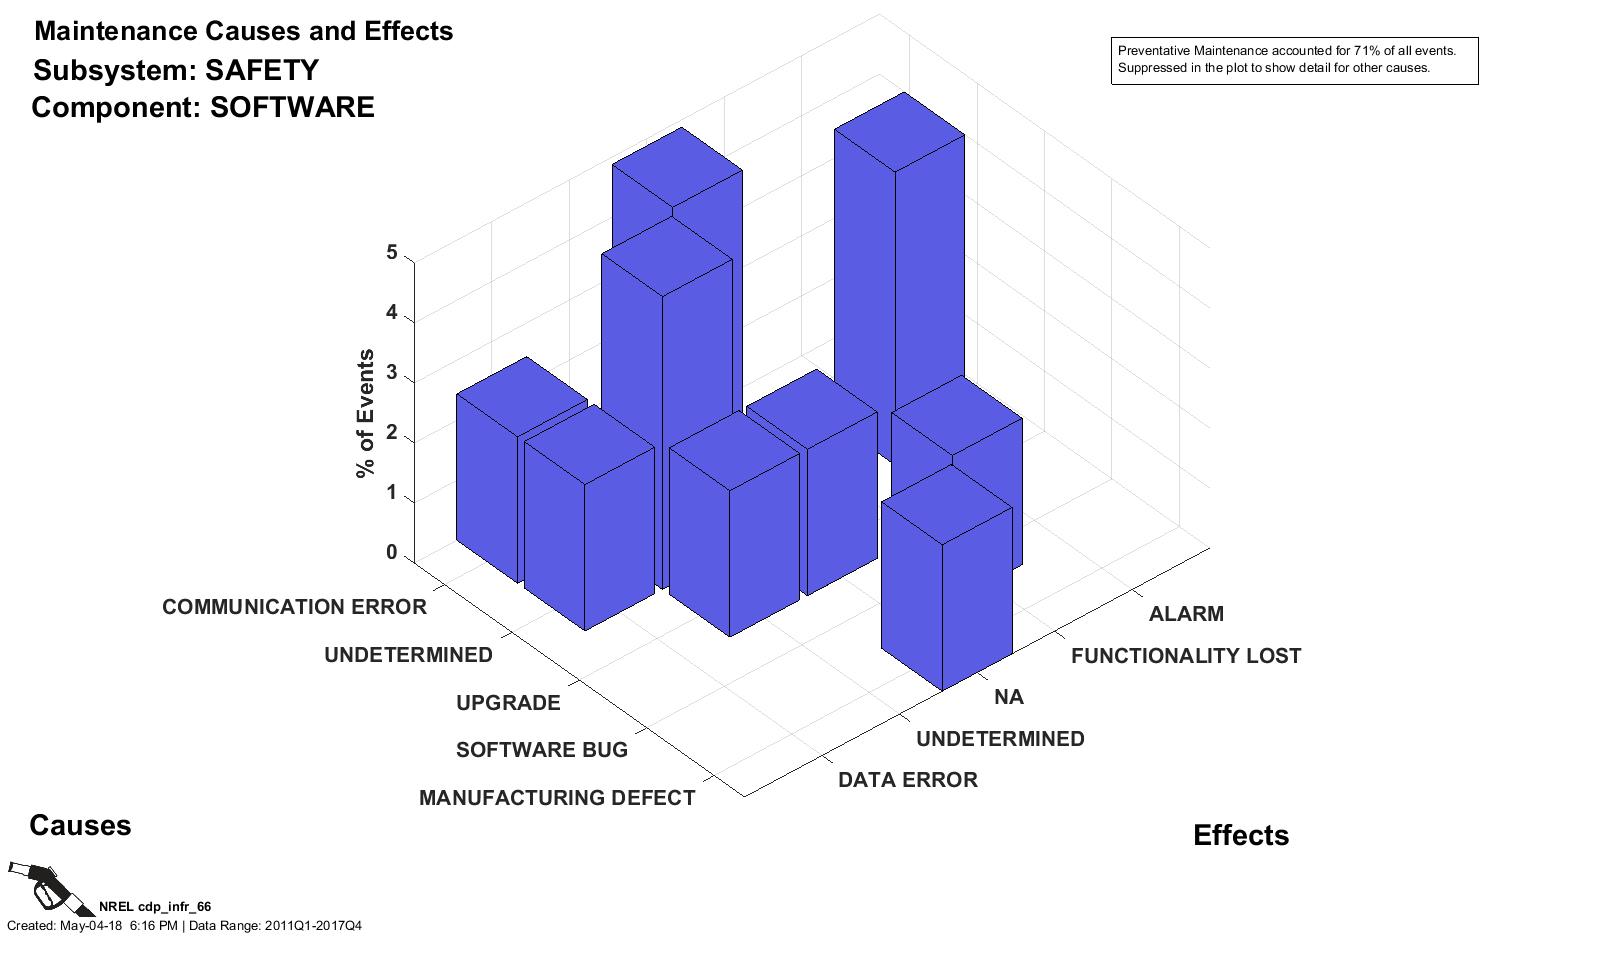
Maintenance Causes and Effects: Safety (Software)
CDP INFR 66, 5/4/18
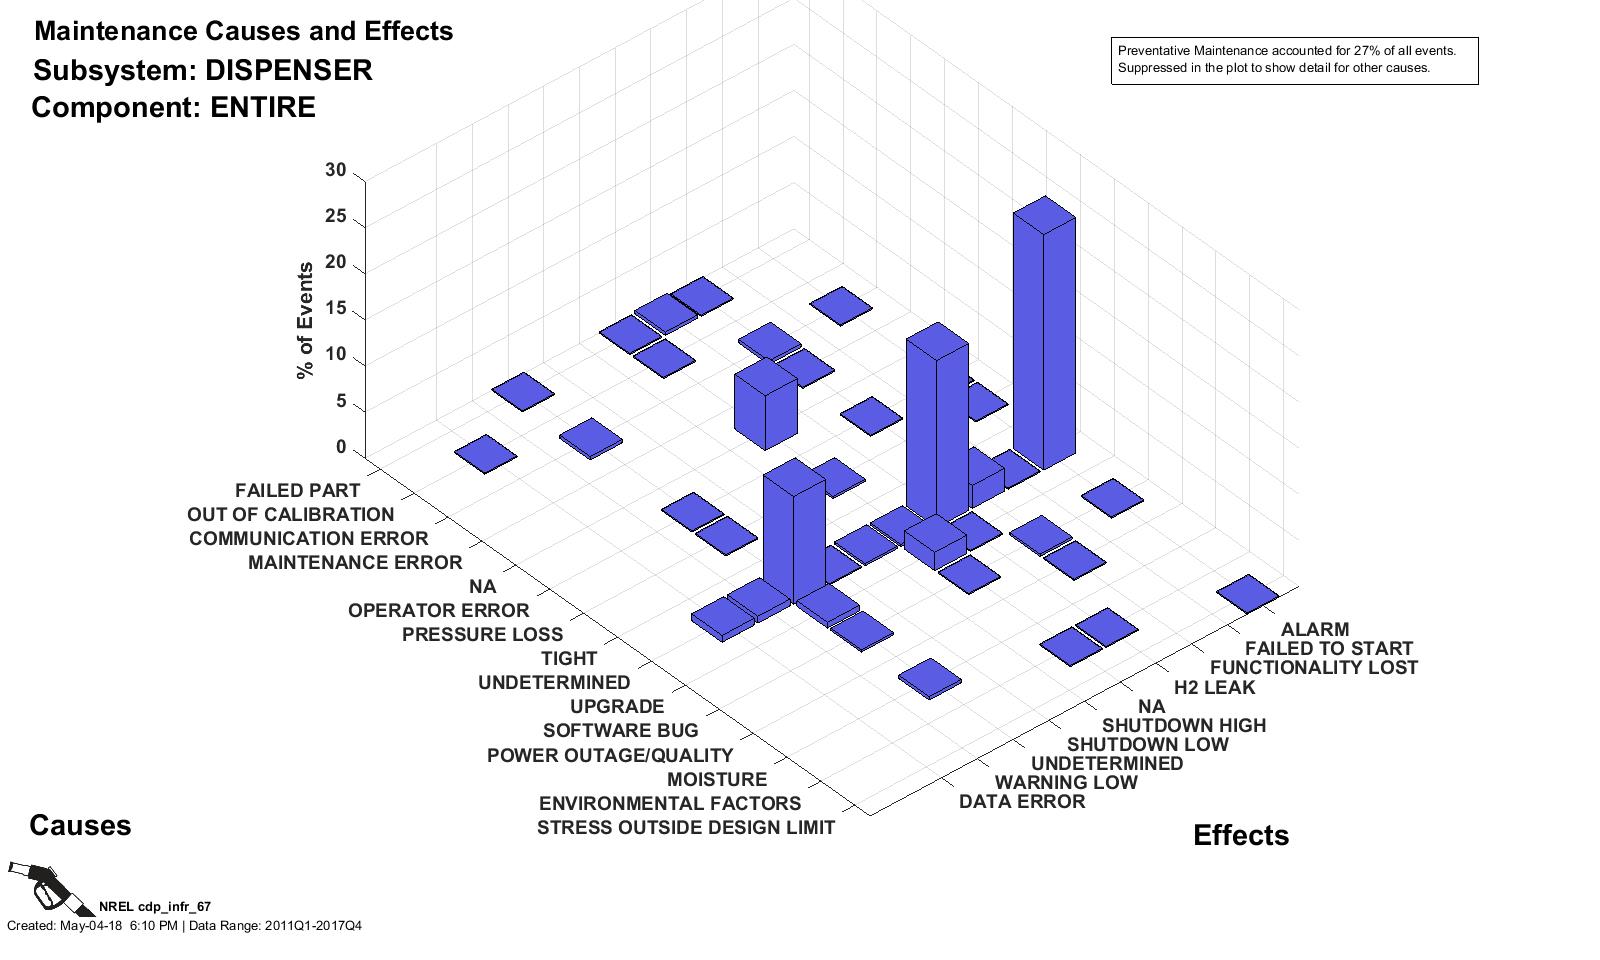
Maintenance Causes and Effects: Dispenser (Entire)
CDP INFR 67, 5/4/18
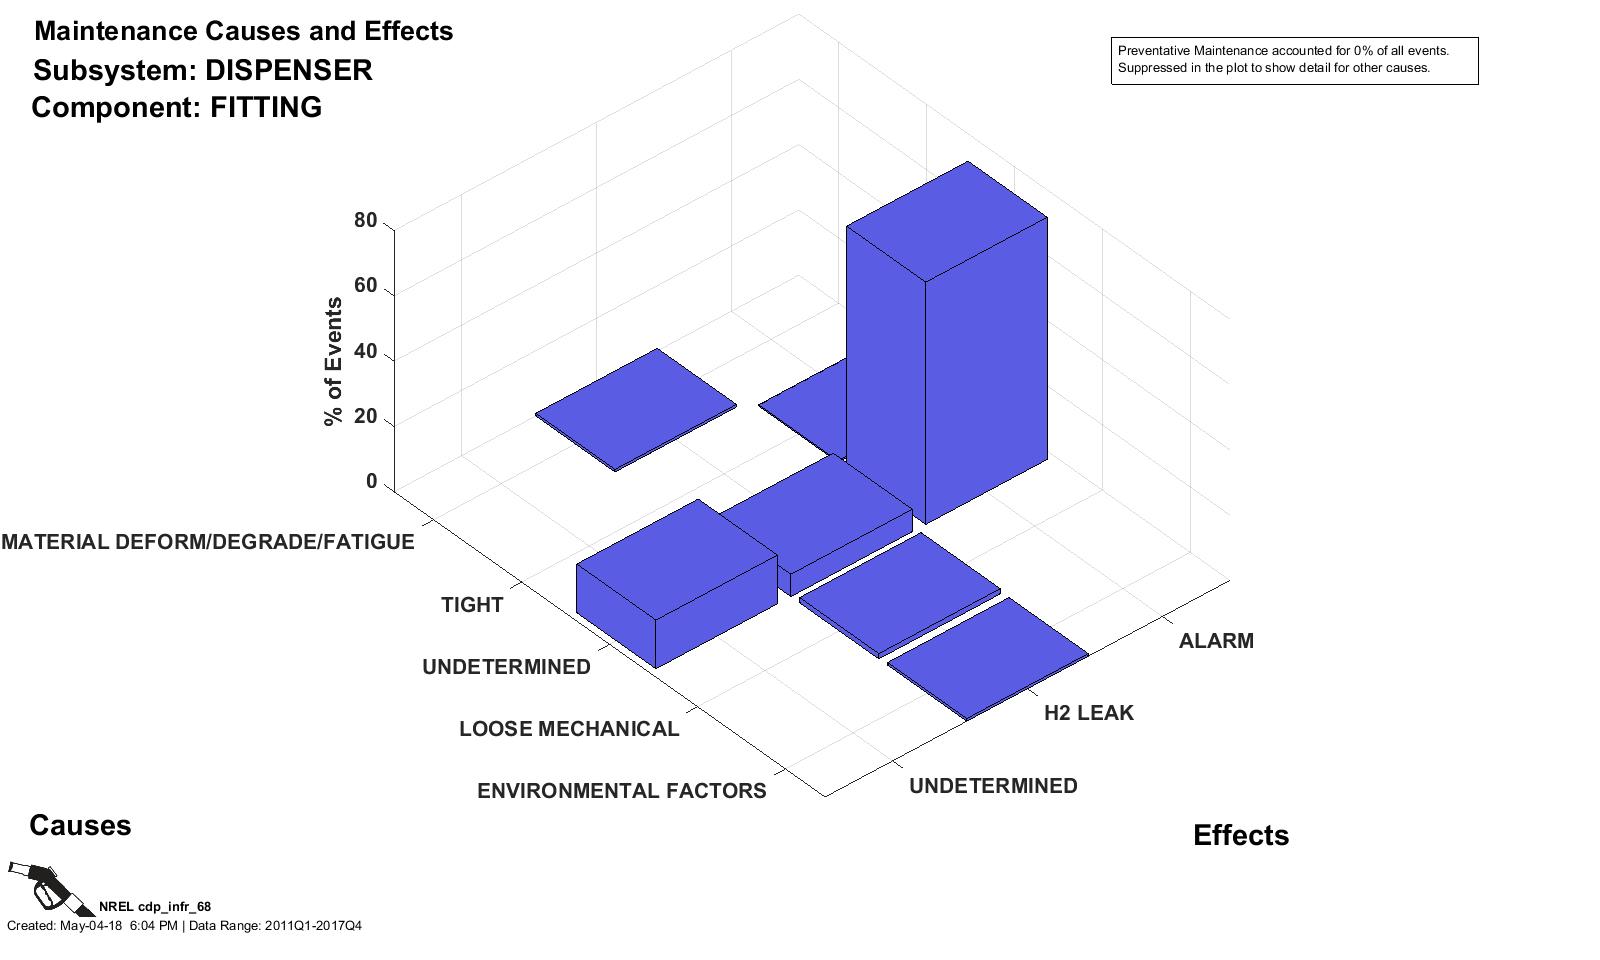
Maintenance Causes and Effects: Dispenser (Fitting)
CDP INFR 68, 5/4/18
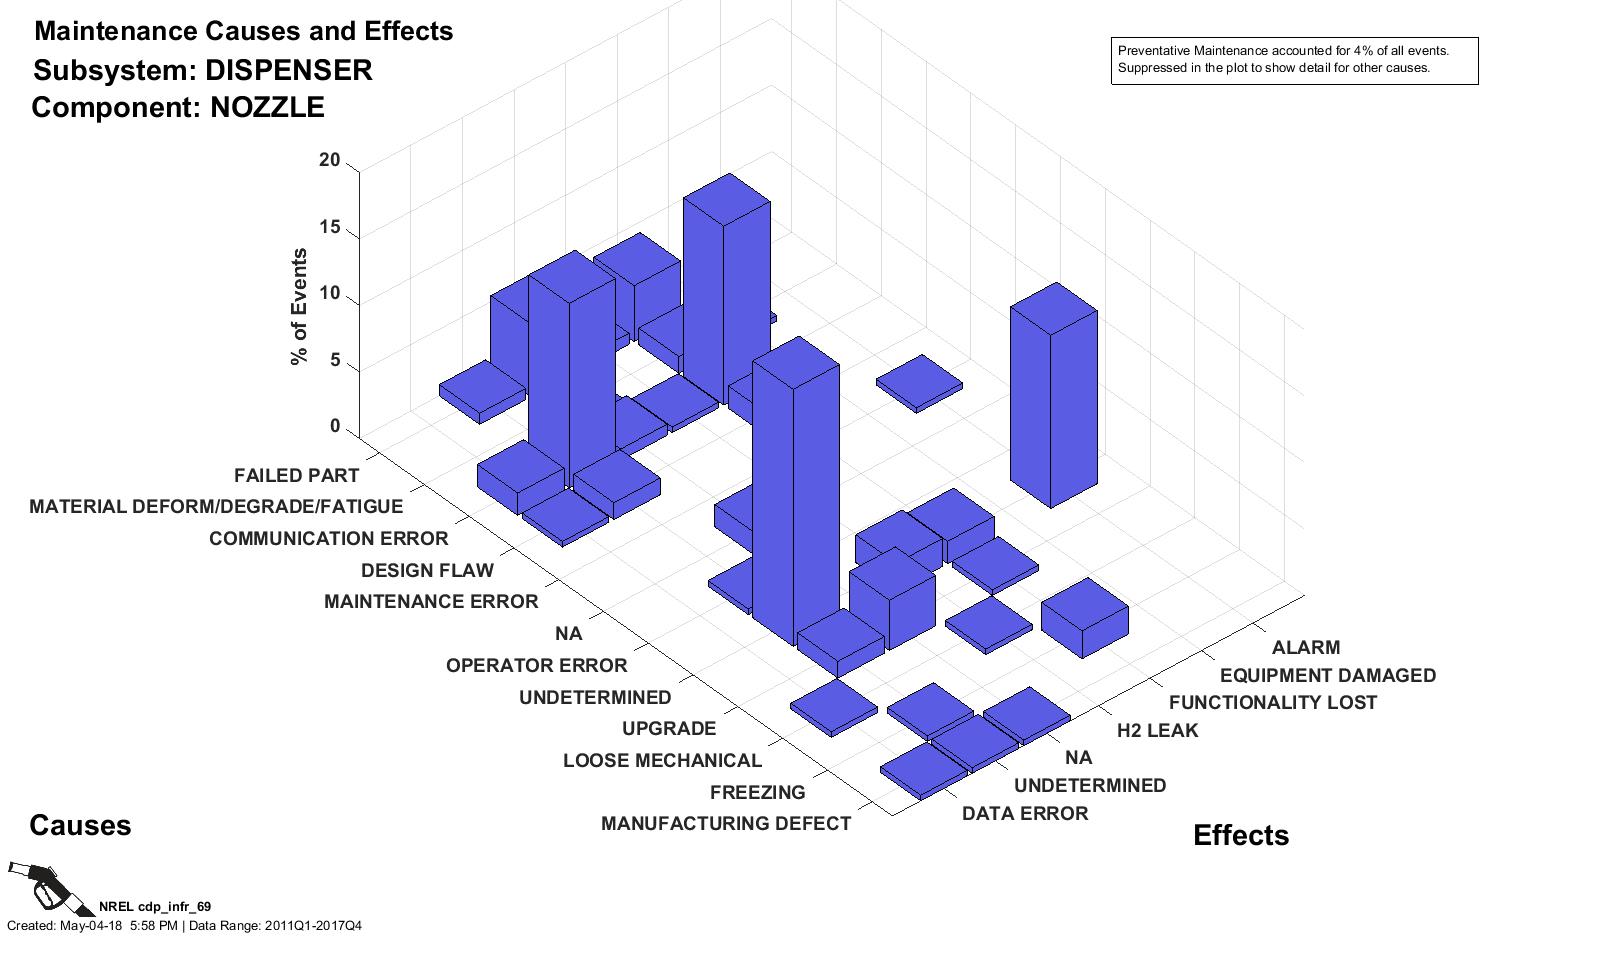
Maintenance Causes and Effects: Dispenser (Nozzle)
CDP INFR 69, 5/4/18
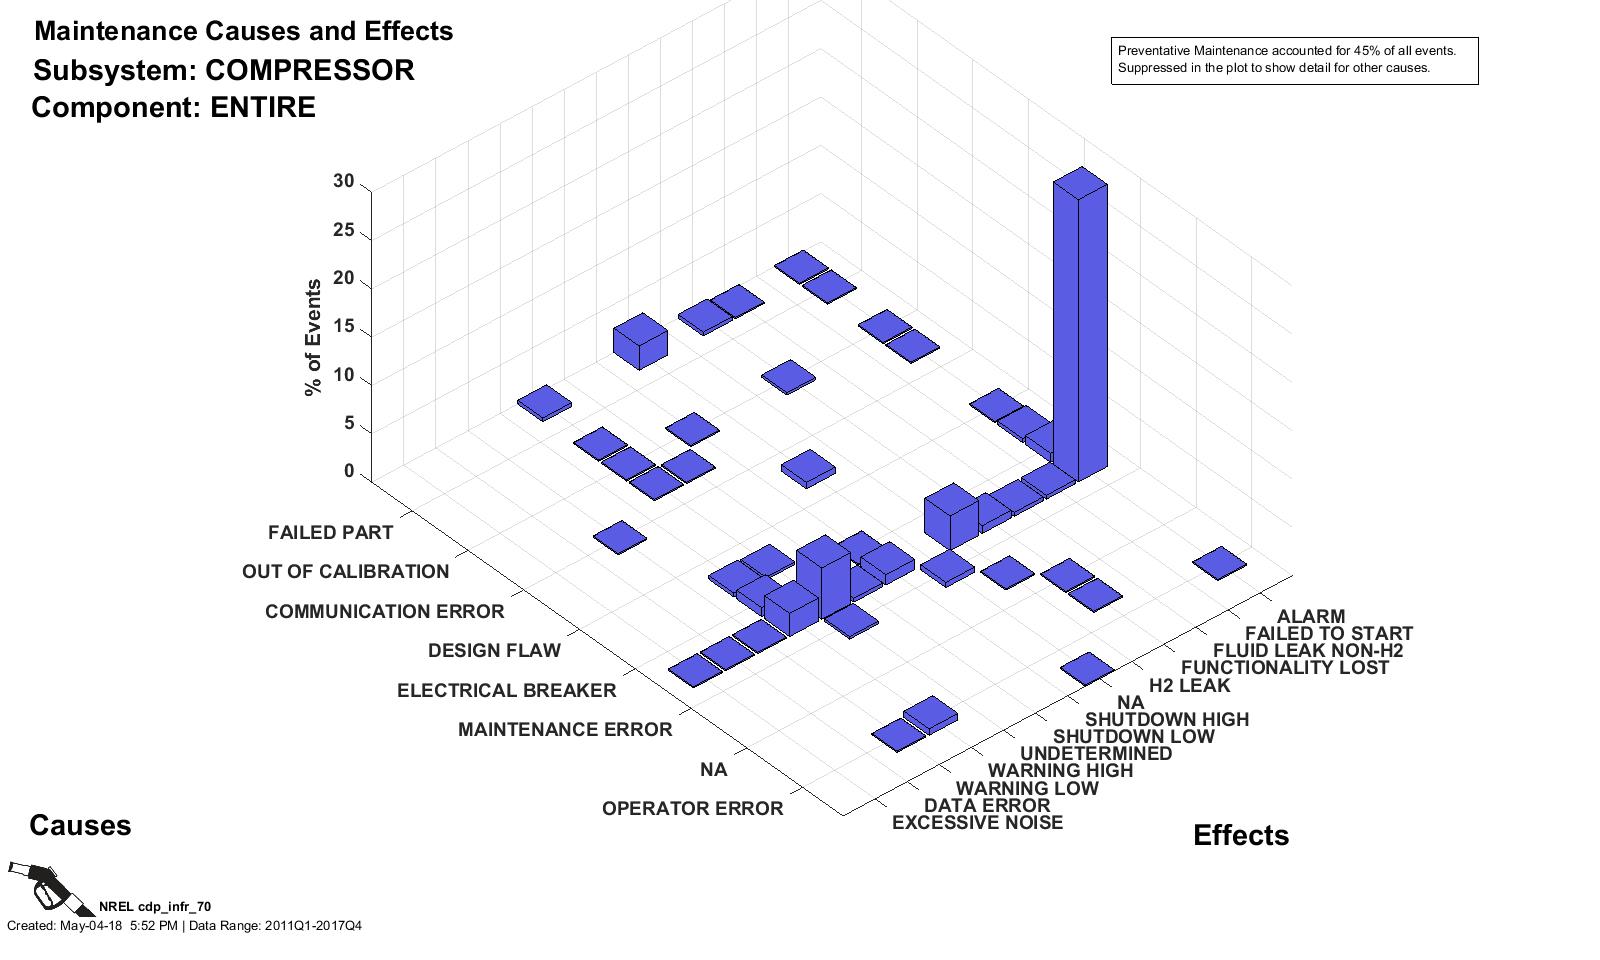
Maintenance Causes and Effects: Compressor (Entire)
CDP INFR 70, 5/4/18
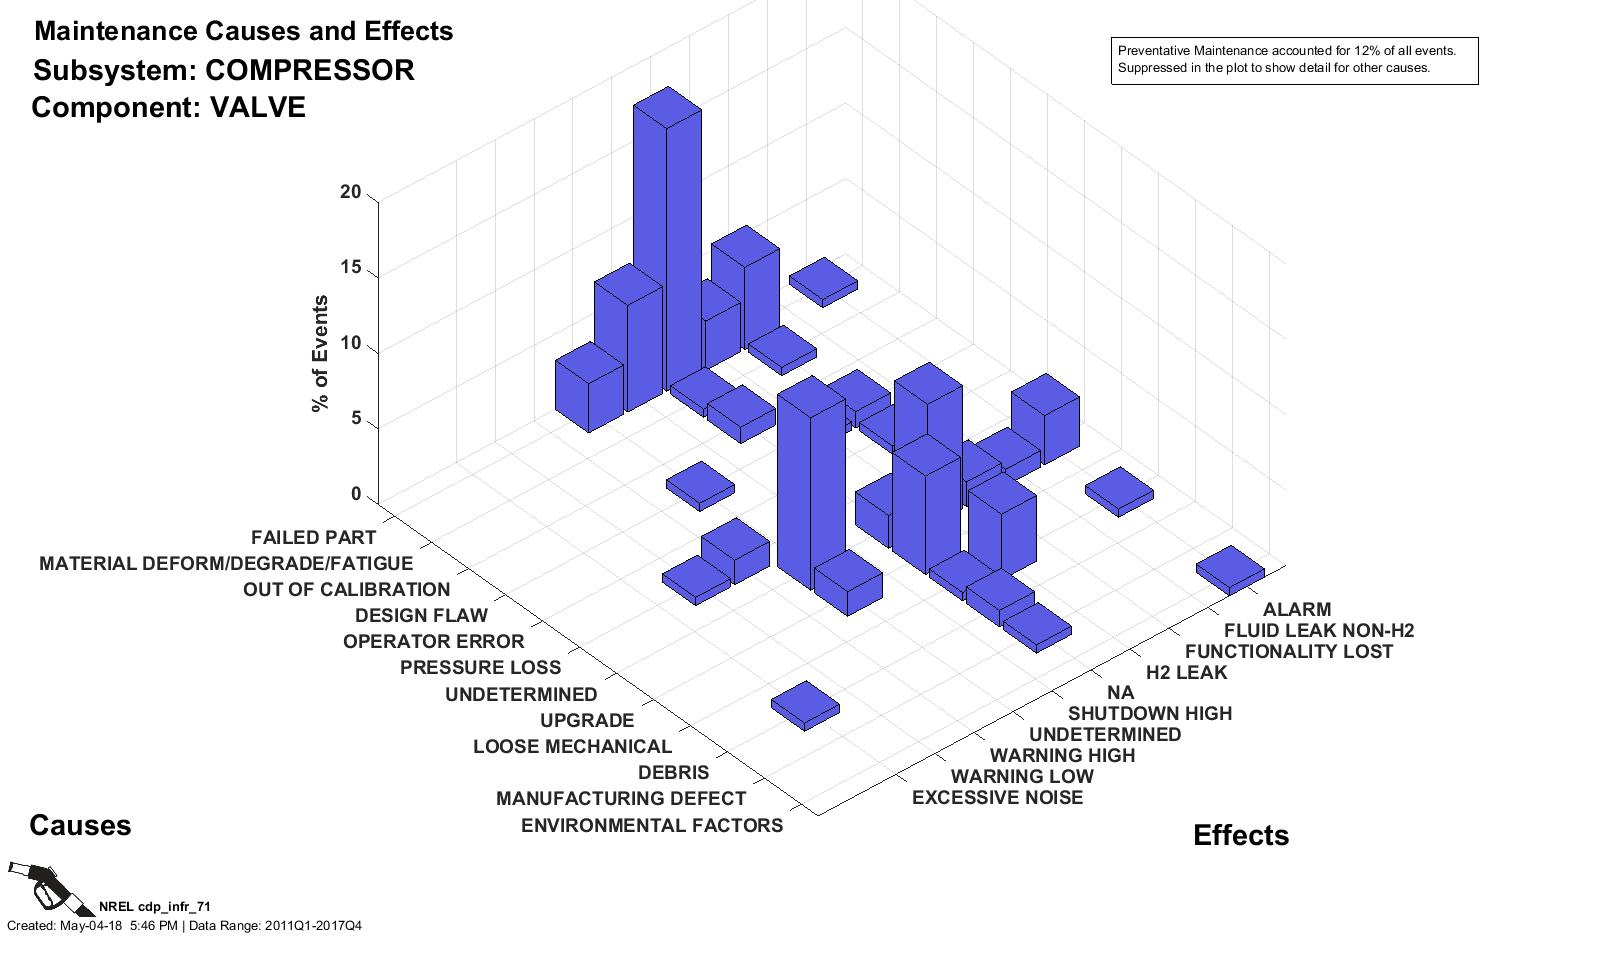
Maintenance Causes and Effects: Compressor (Valve)
CDP INFR 71, 5/4/18
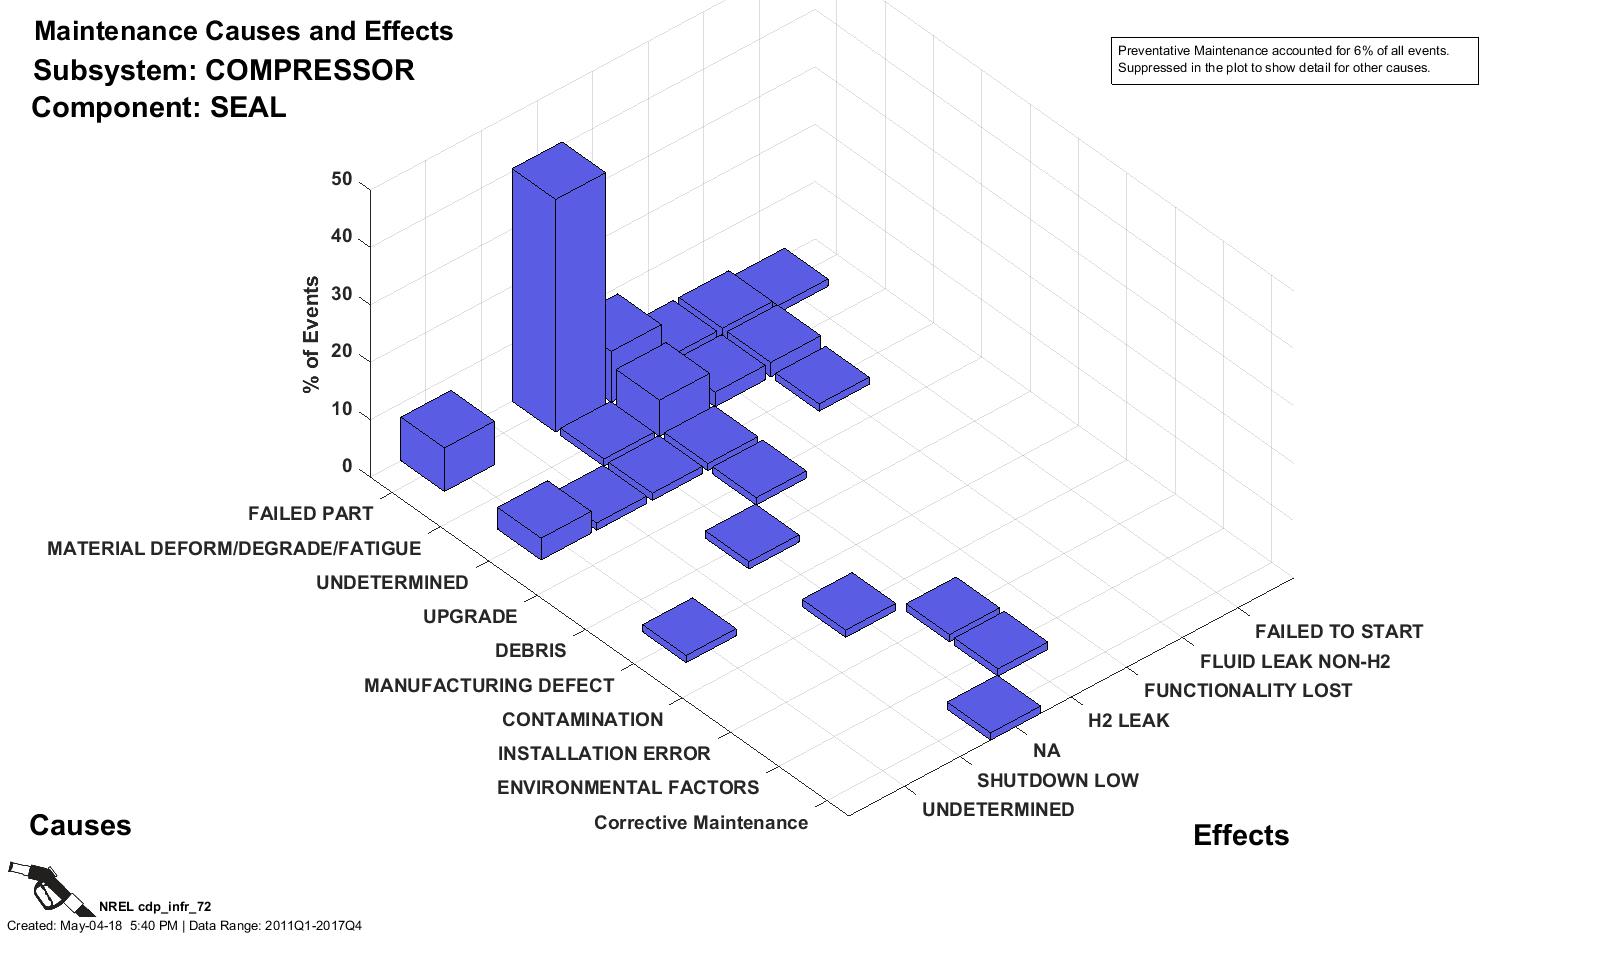
Maintenance Causes and Effects: Compressor (Seal)
CDP INFR 72, 5/4/18
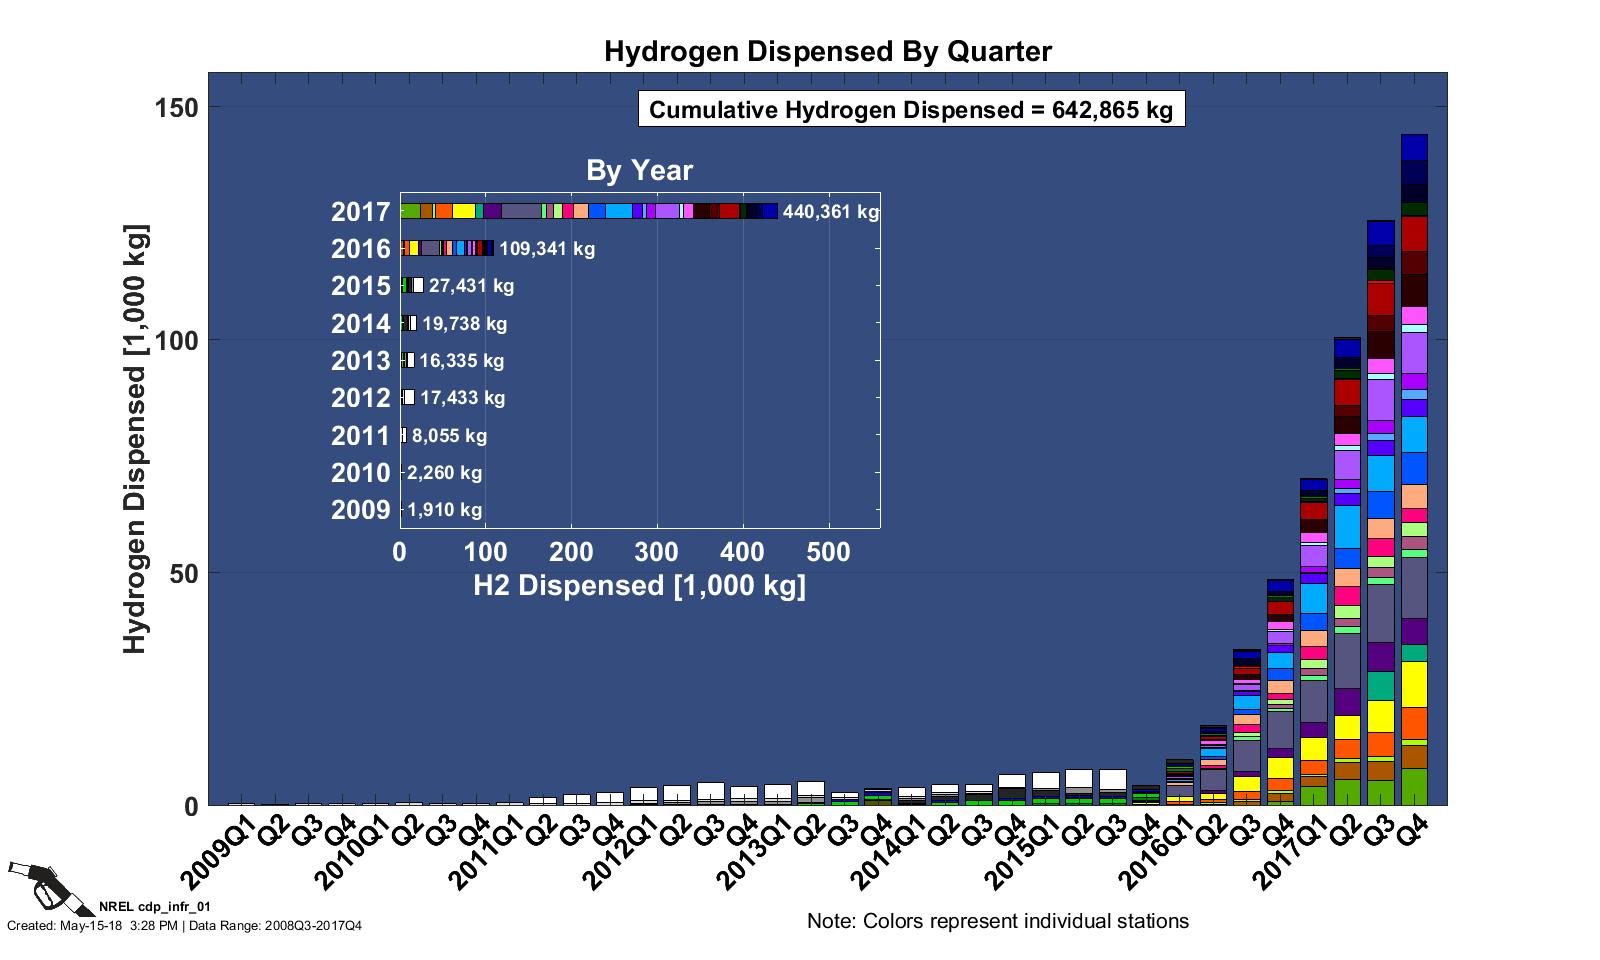
Hydrogen Dispensed by Quarter
CDP INFR 01, 5/15/18
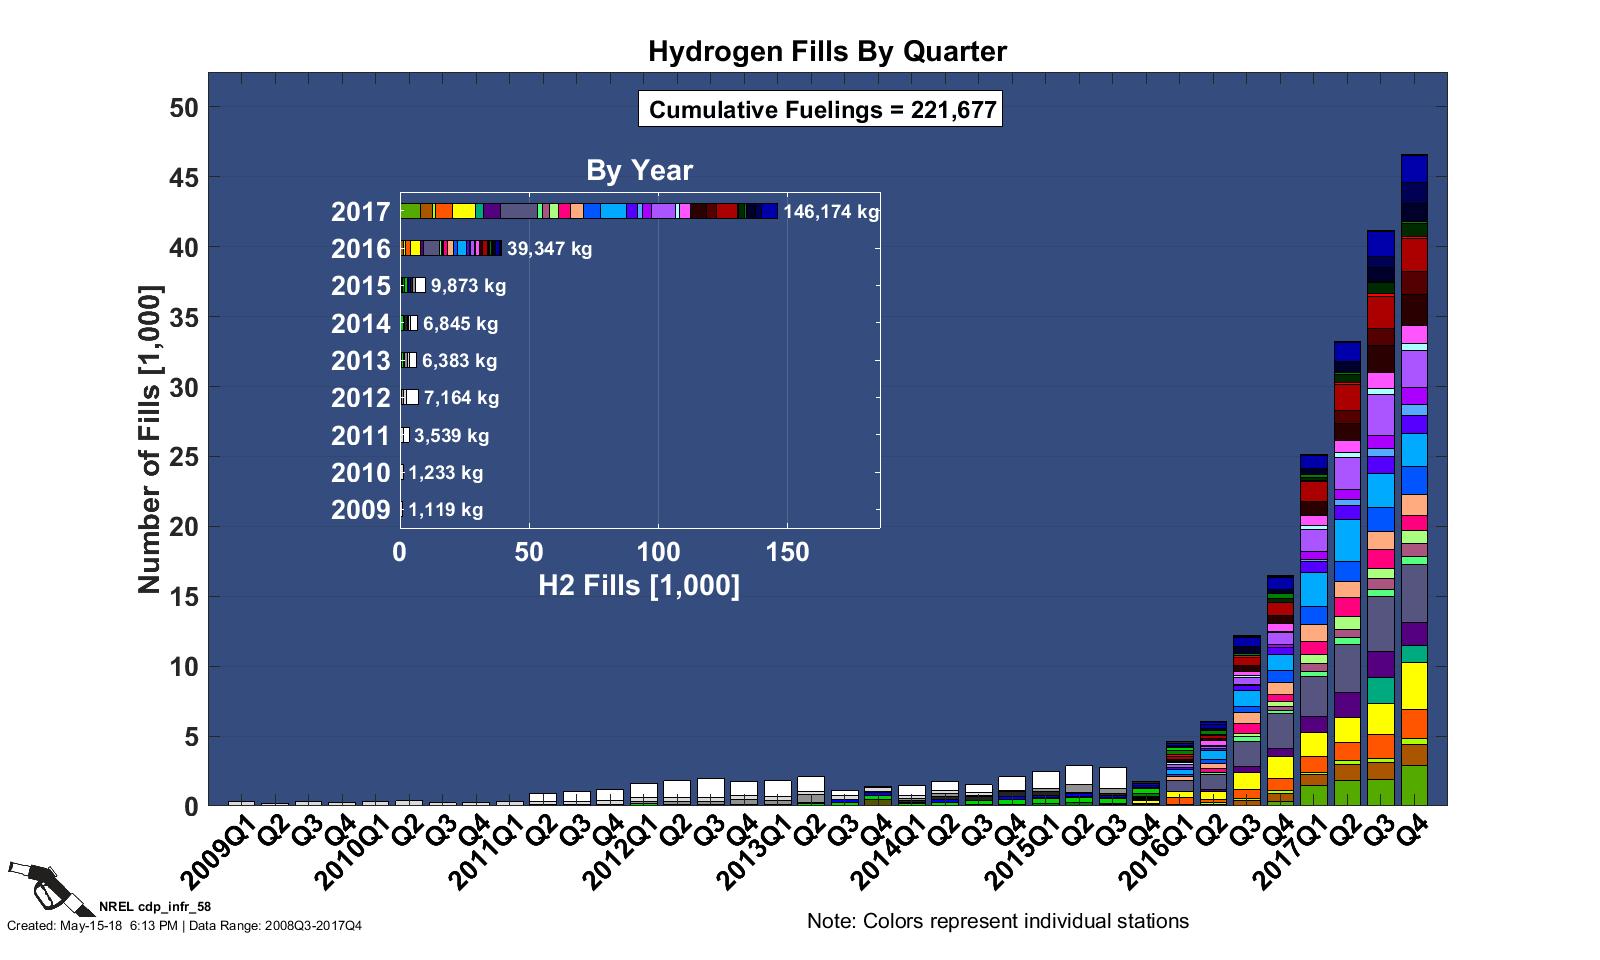
Hydrogen Fills by Quarter
CDP INFR 58, 5/15/18
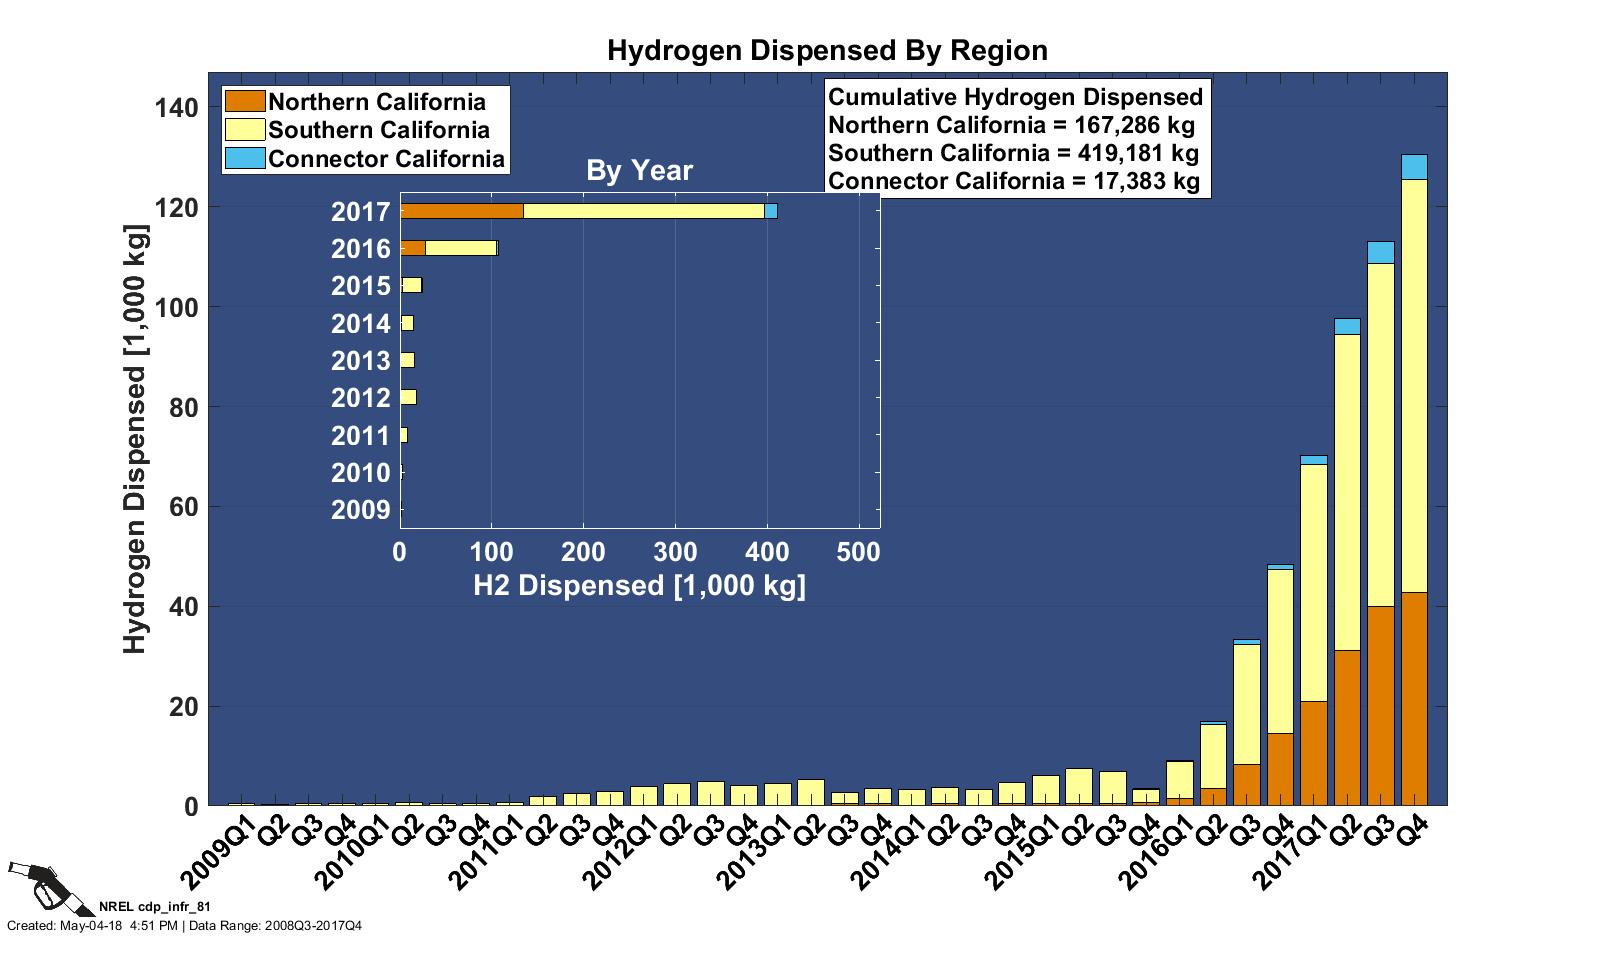
Hydrogen Dispensed by Region
CDP INFR 81, 5/4/18
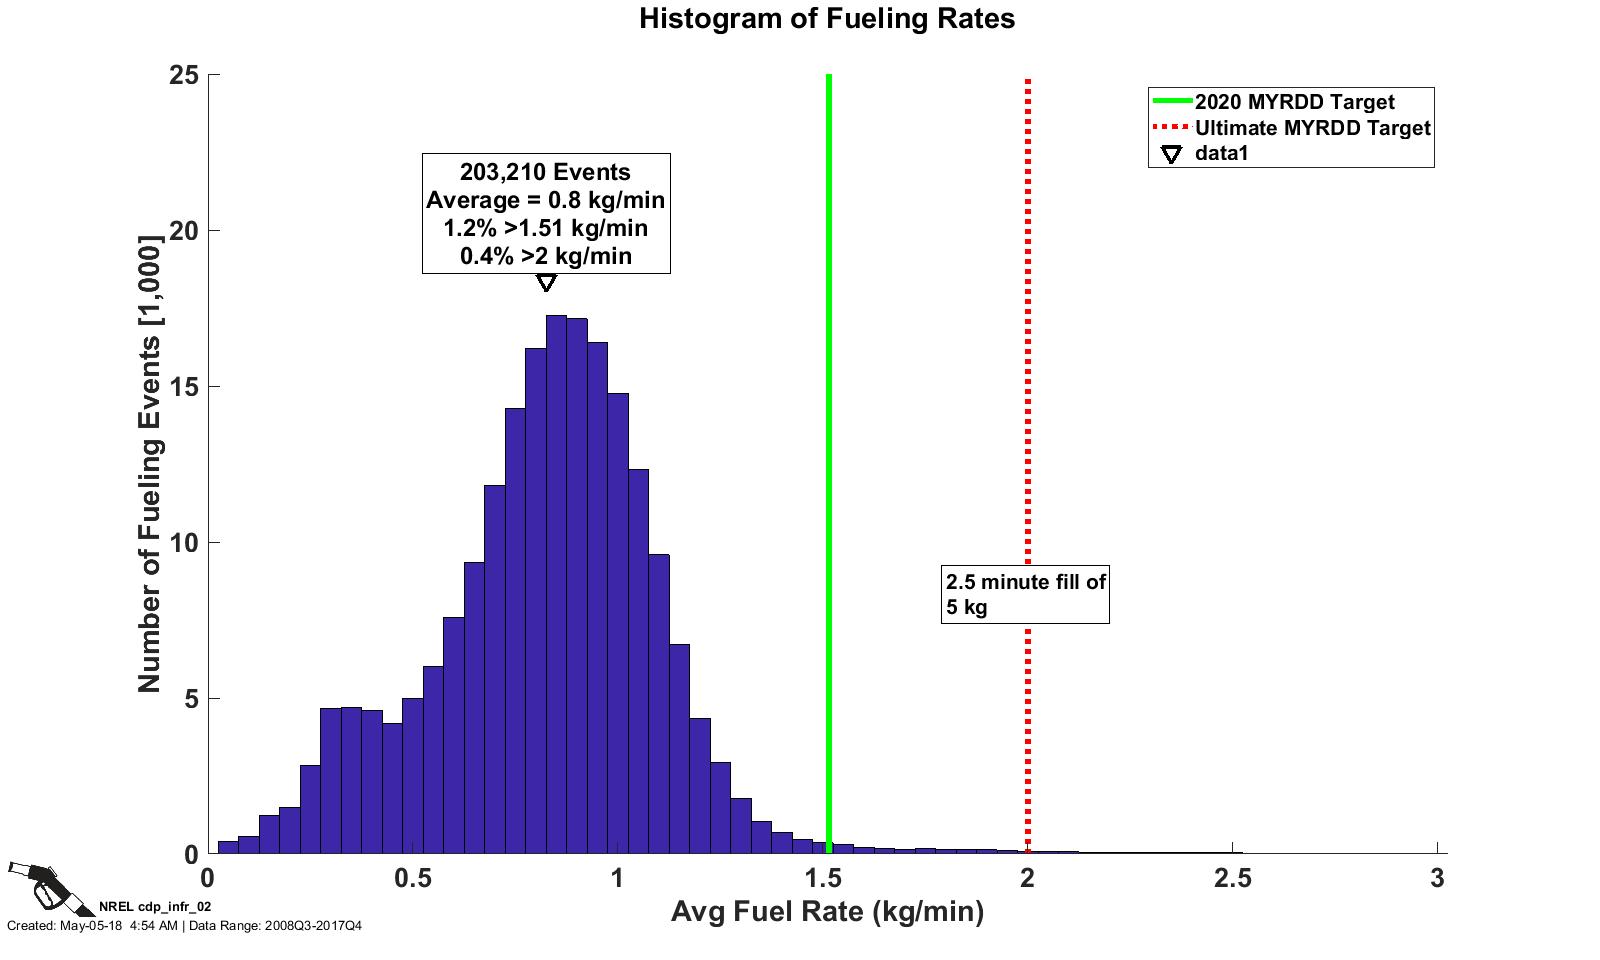
Histogram of Fueling Rates
CDP INFR 02, 5/5/18
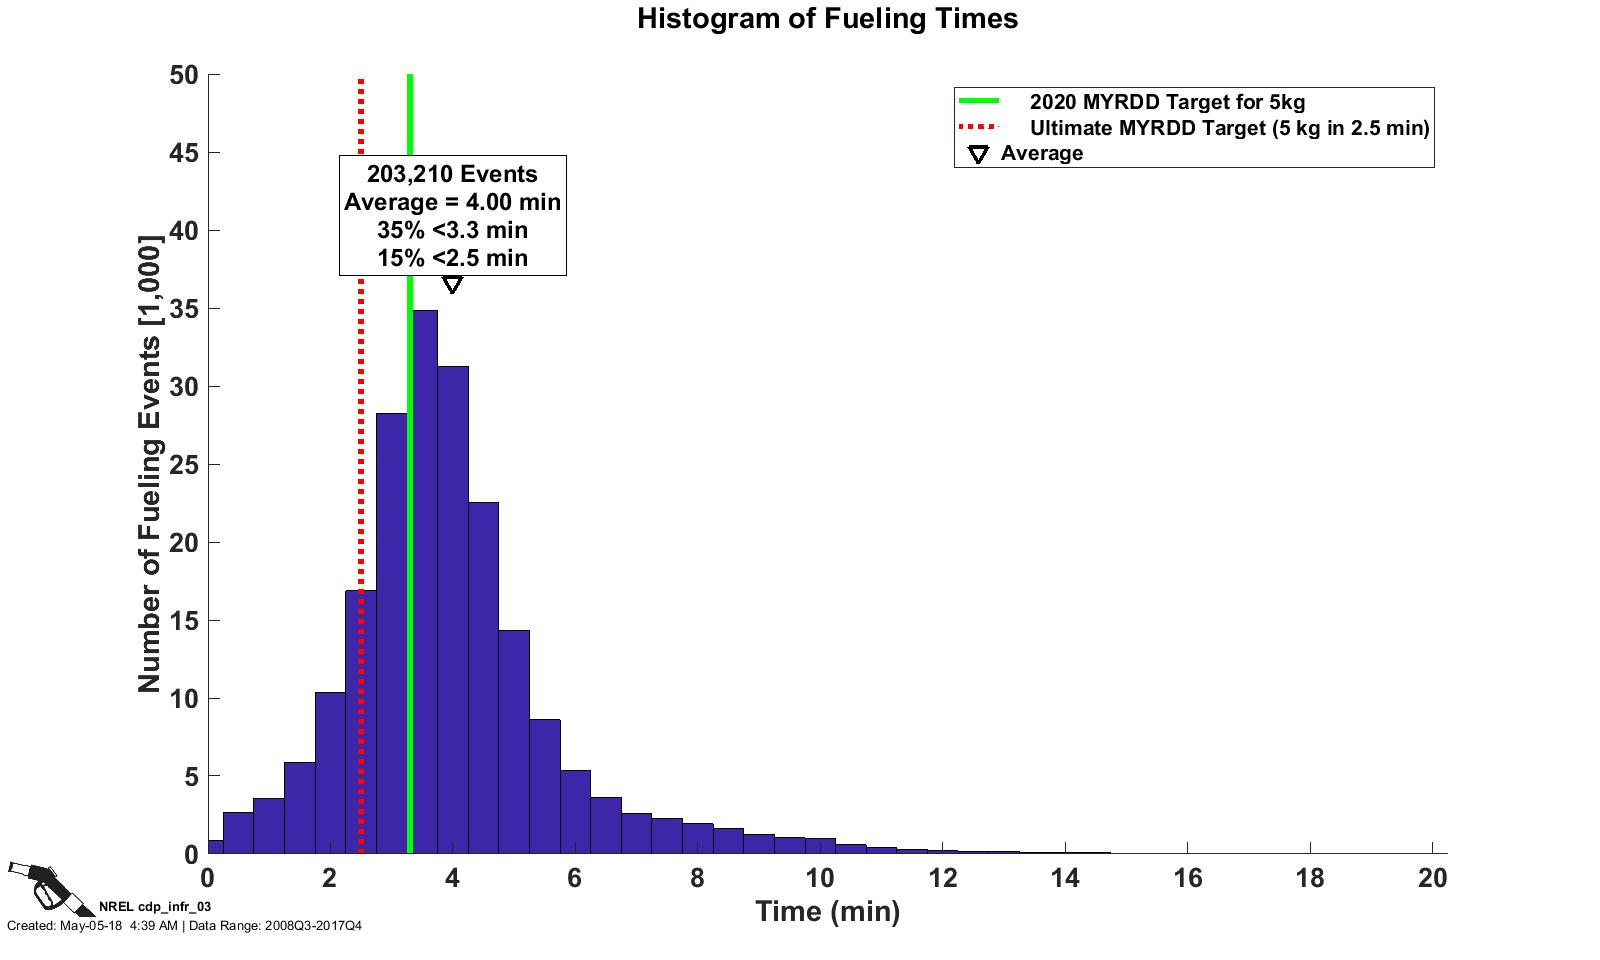
Histogram of Fueling Times
CDP INFR 03, 5/5/18
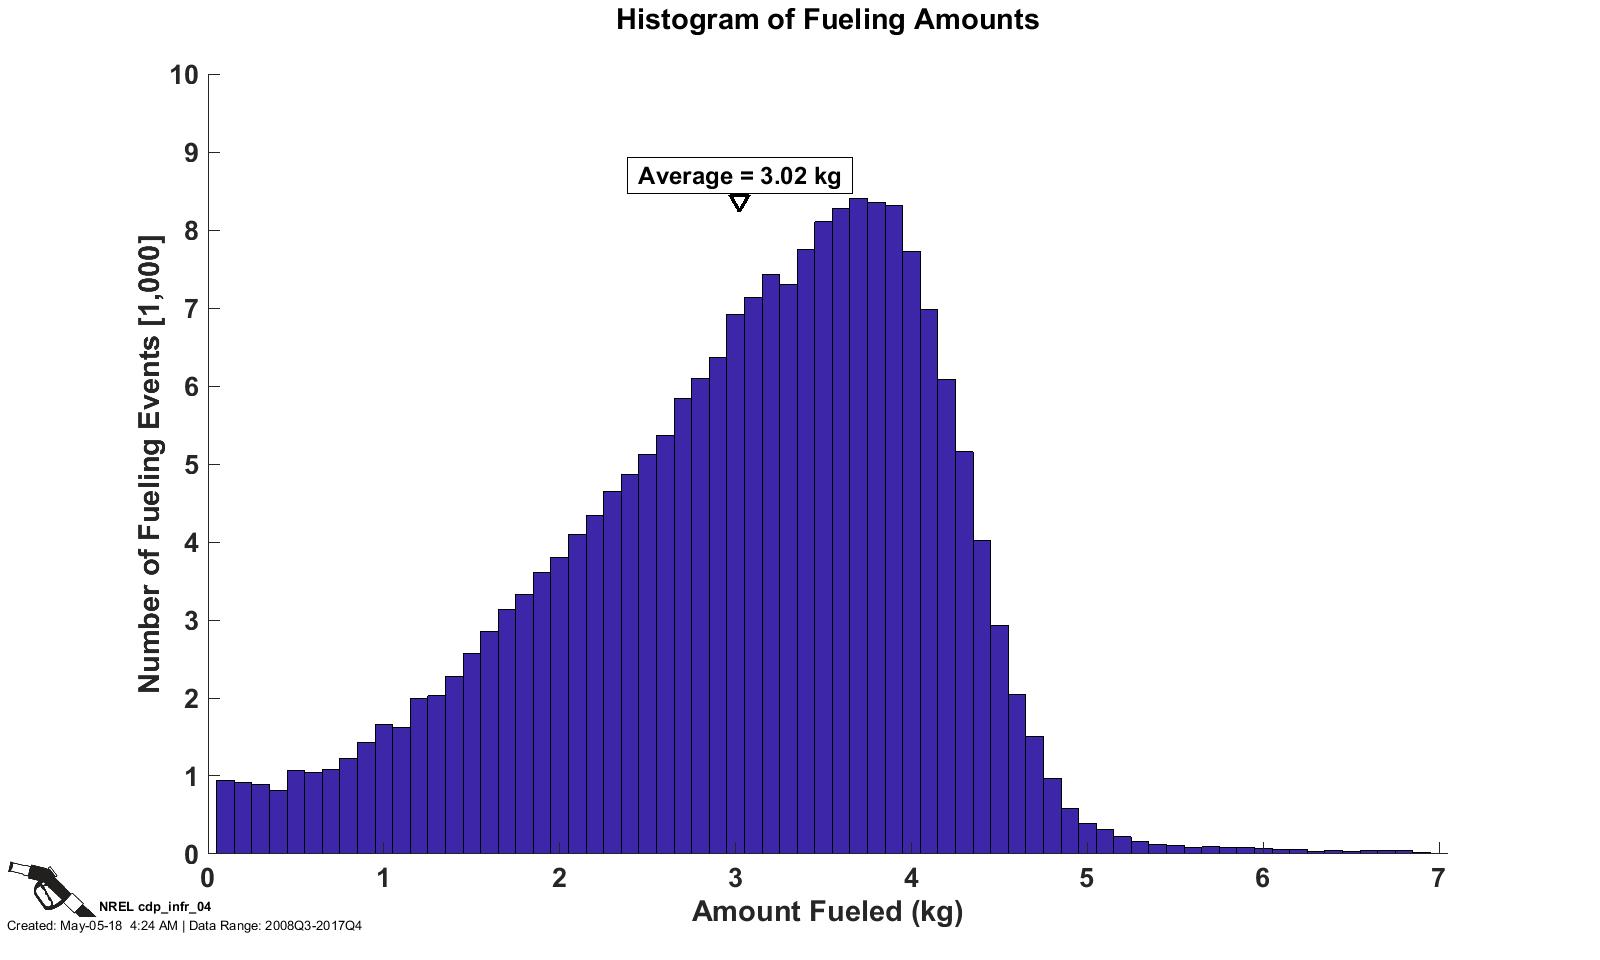
Histogram of Fueling Amounts
CDP INFR 04, 5/5/18
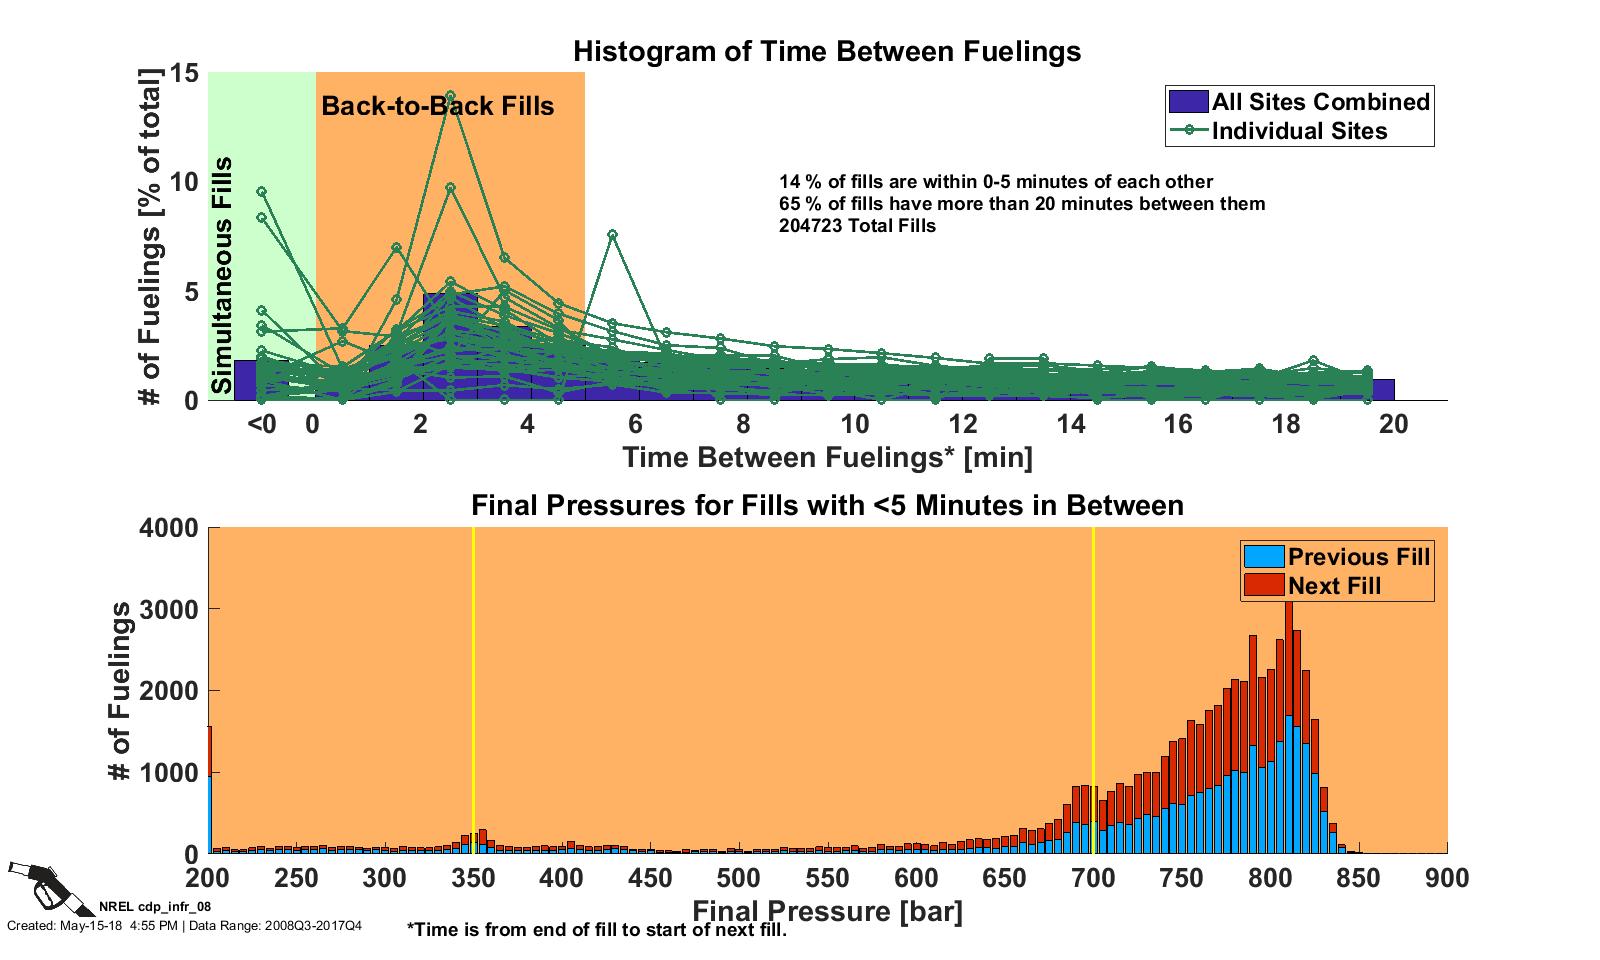
Time Between Fueling
CDP INFR 08, 5/15/18
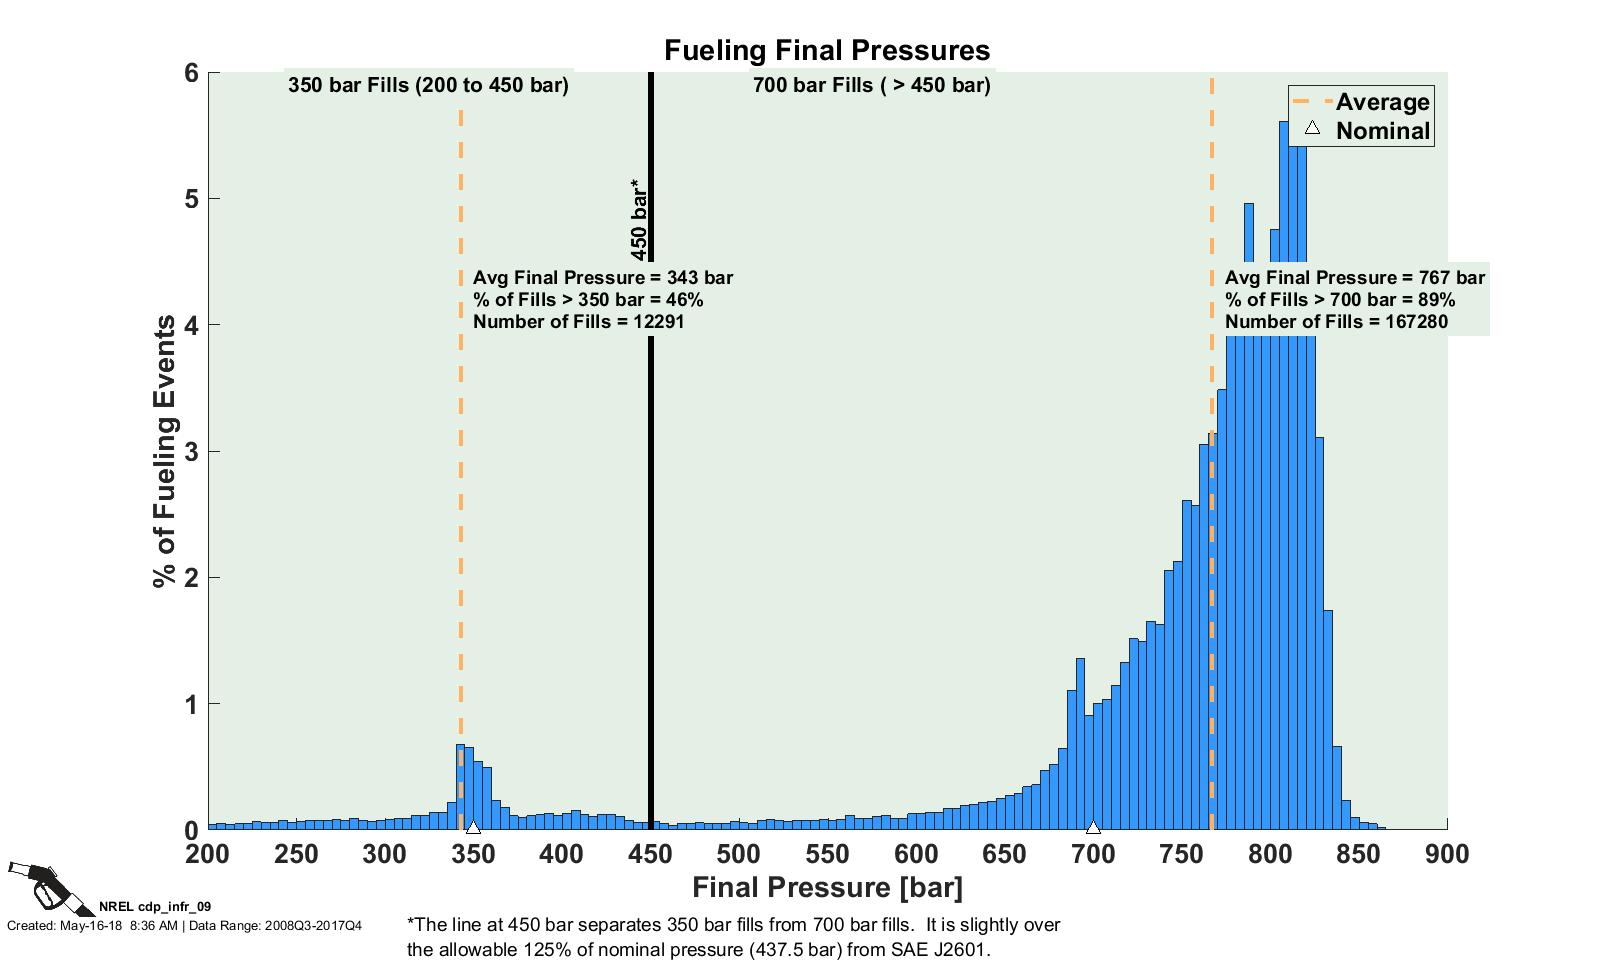
Fueling Final Pressures
CDP INFR 09, 5/16/18
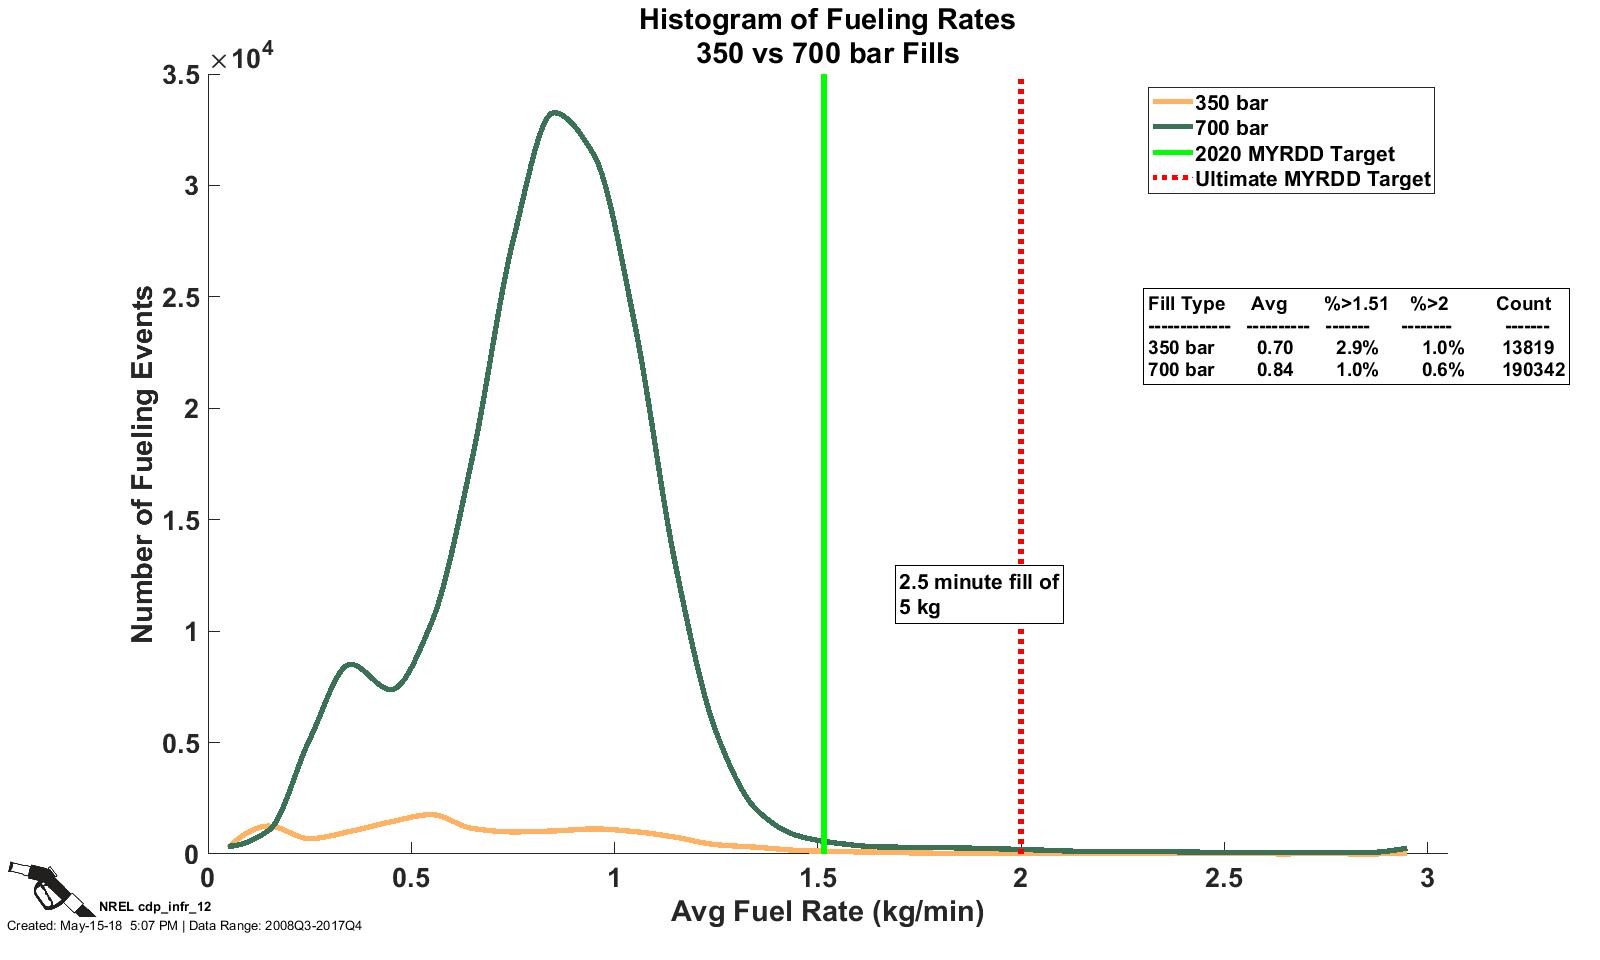
Fueling Rates 350 bar vs. 700 bar
CDP INFR 12, 5/15/18
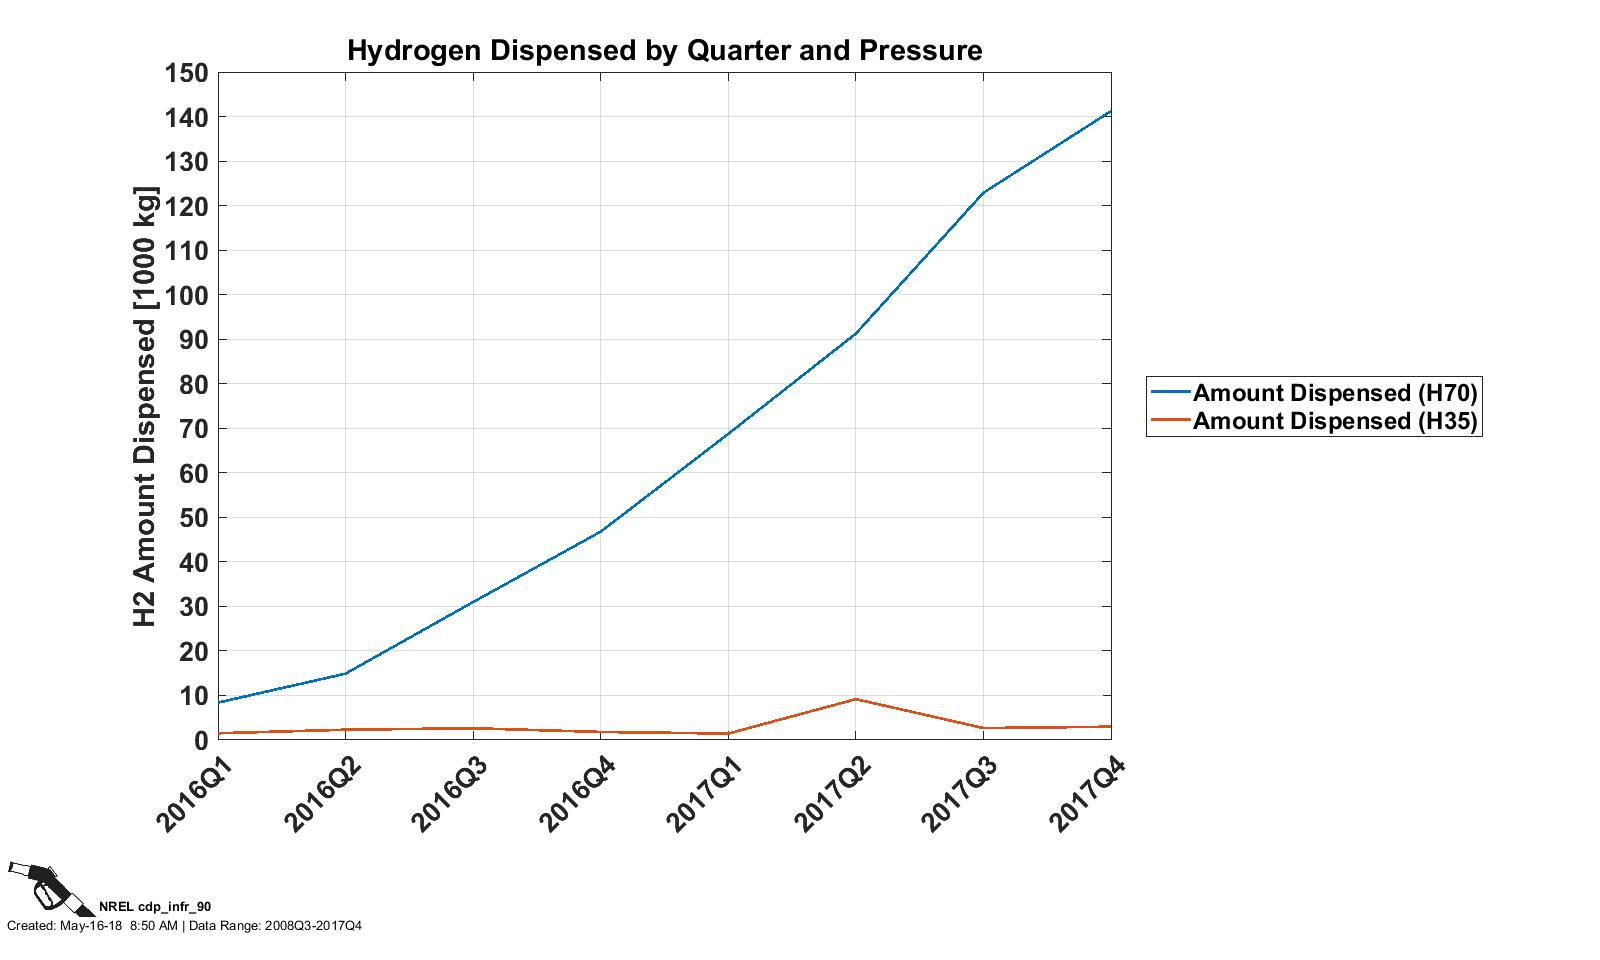
Hydrogen Dispensed by Quarter and Pressure
CDP INFR 90, 5/16/18
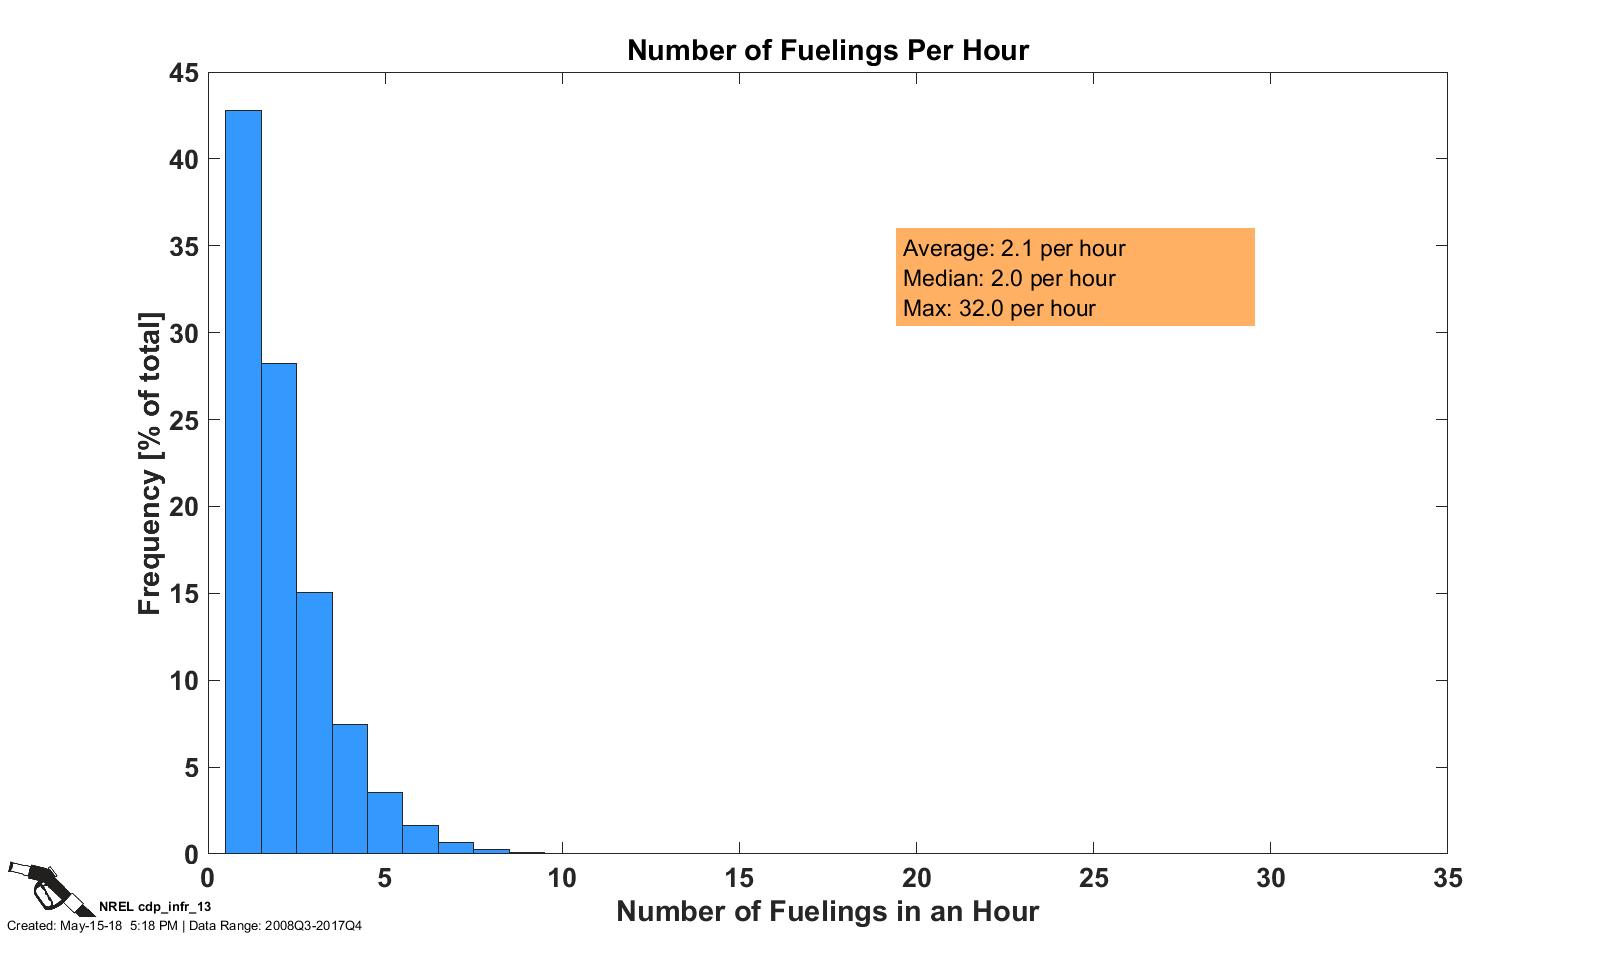
Number of Fueling Events per Hour
CDP INFR 13, 5/5/18
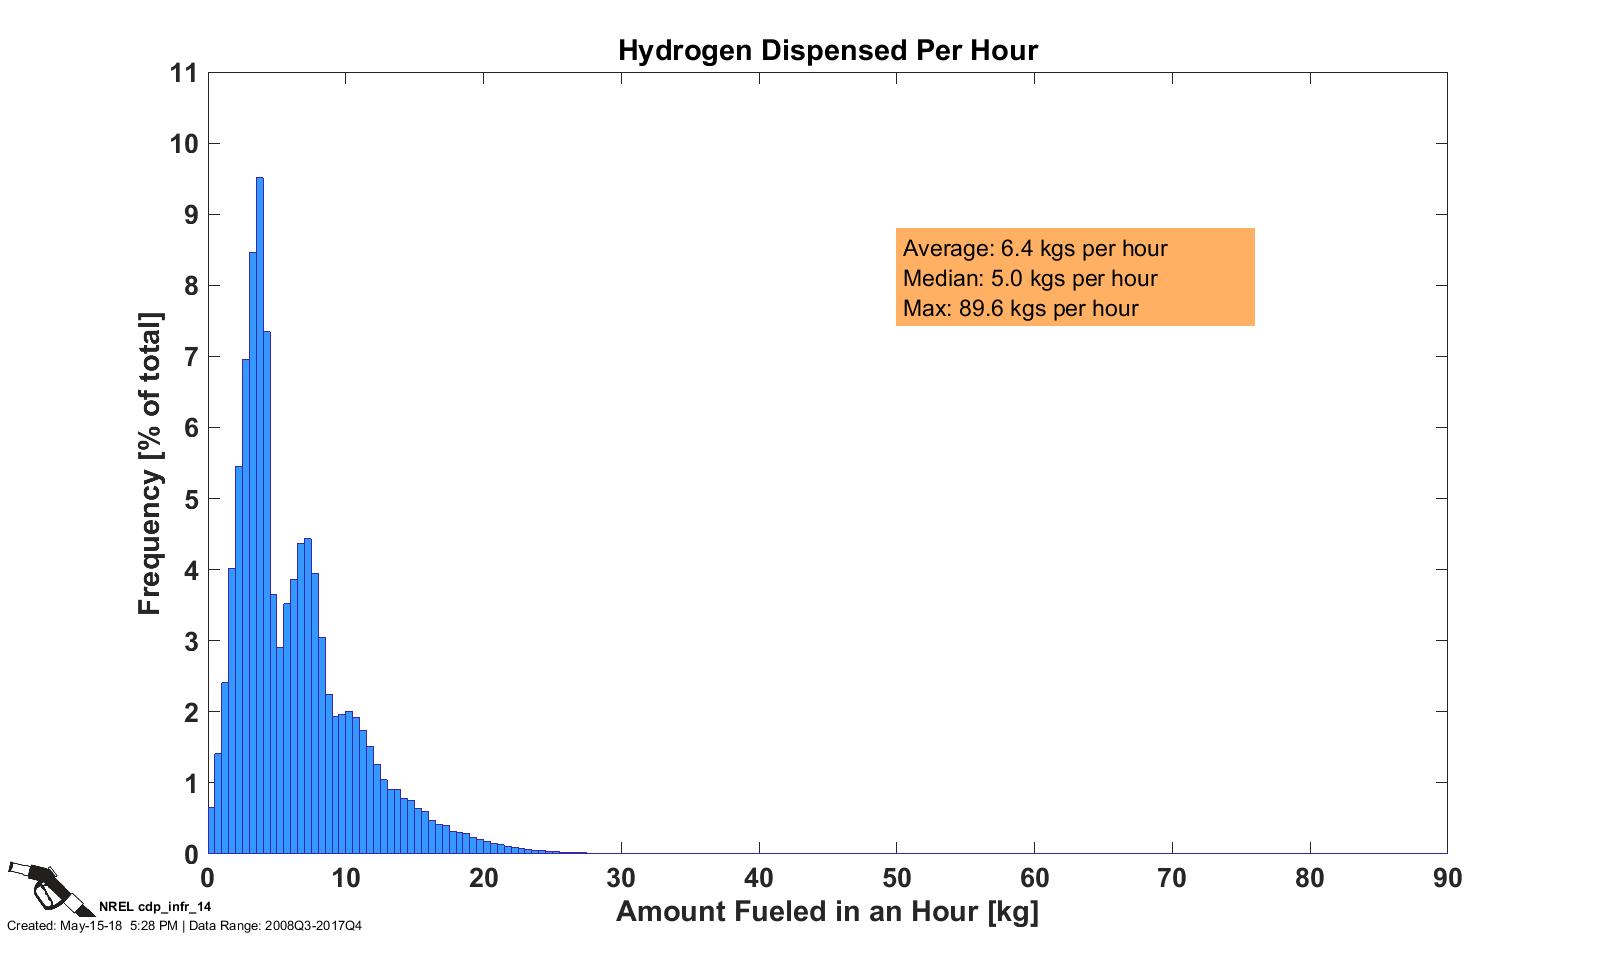
Hydrogen Dispensed per Hour
CDP INFR 14, 5/15/18
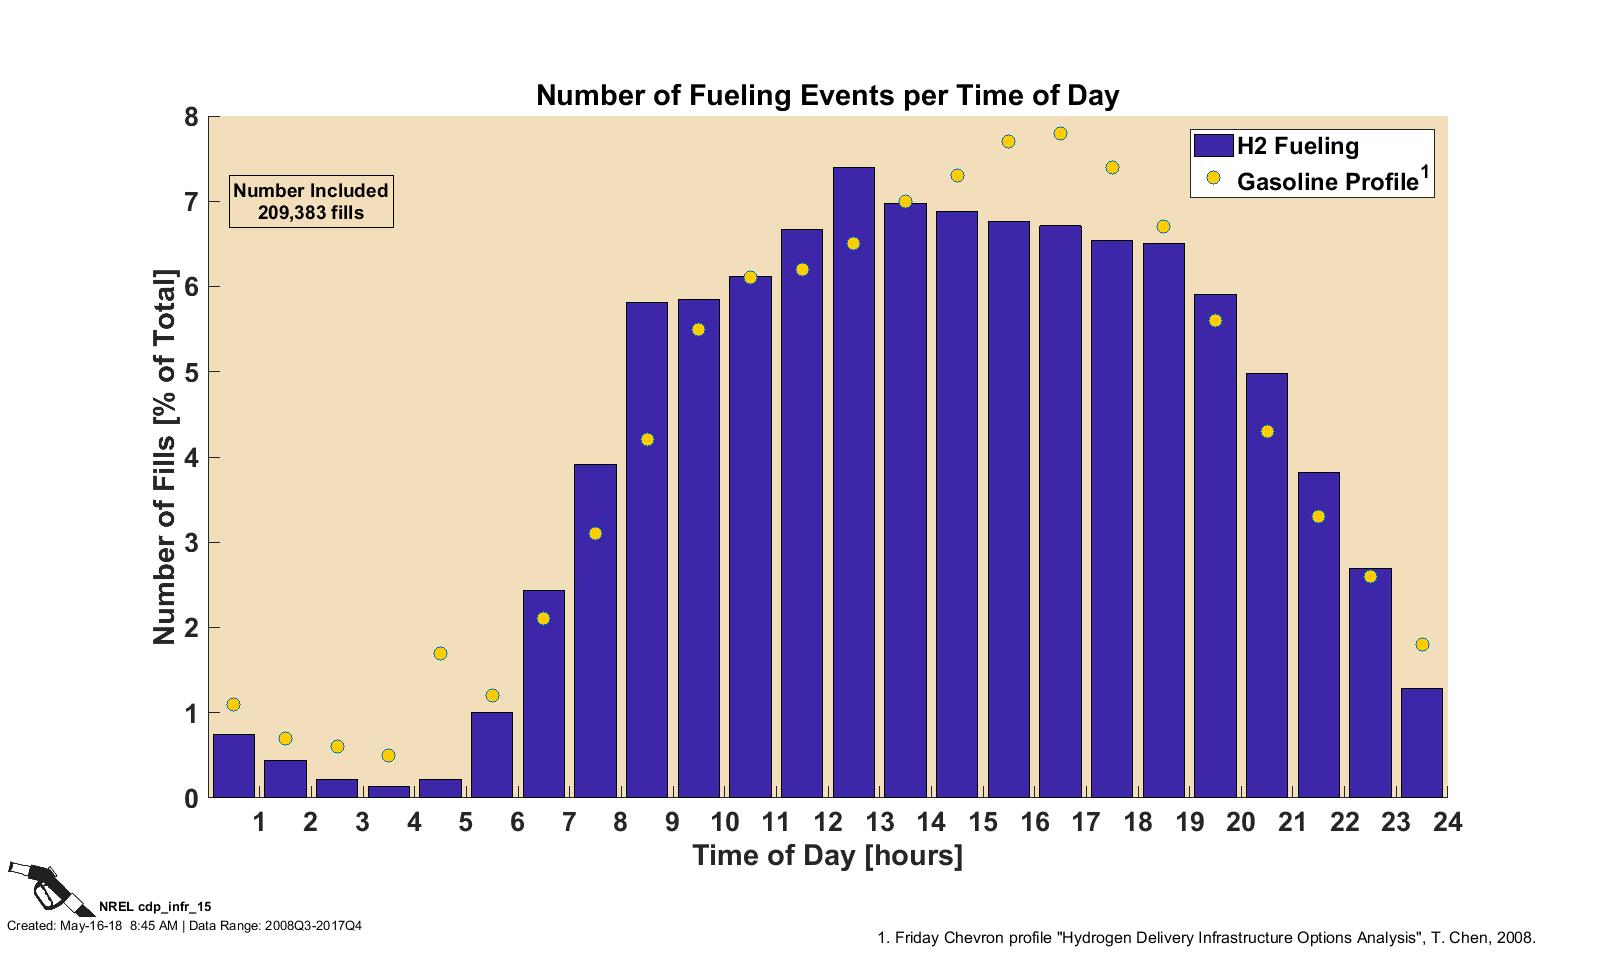
Number of Fills by Time of Day
CDP INFR 15, 5/16/18
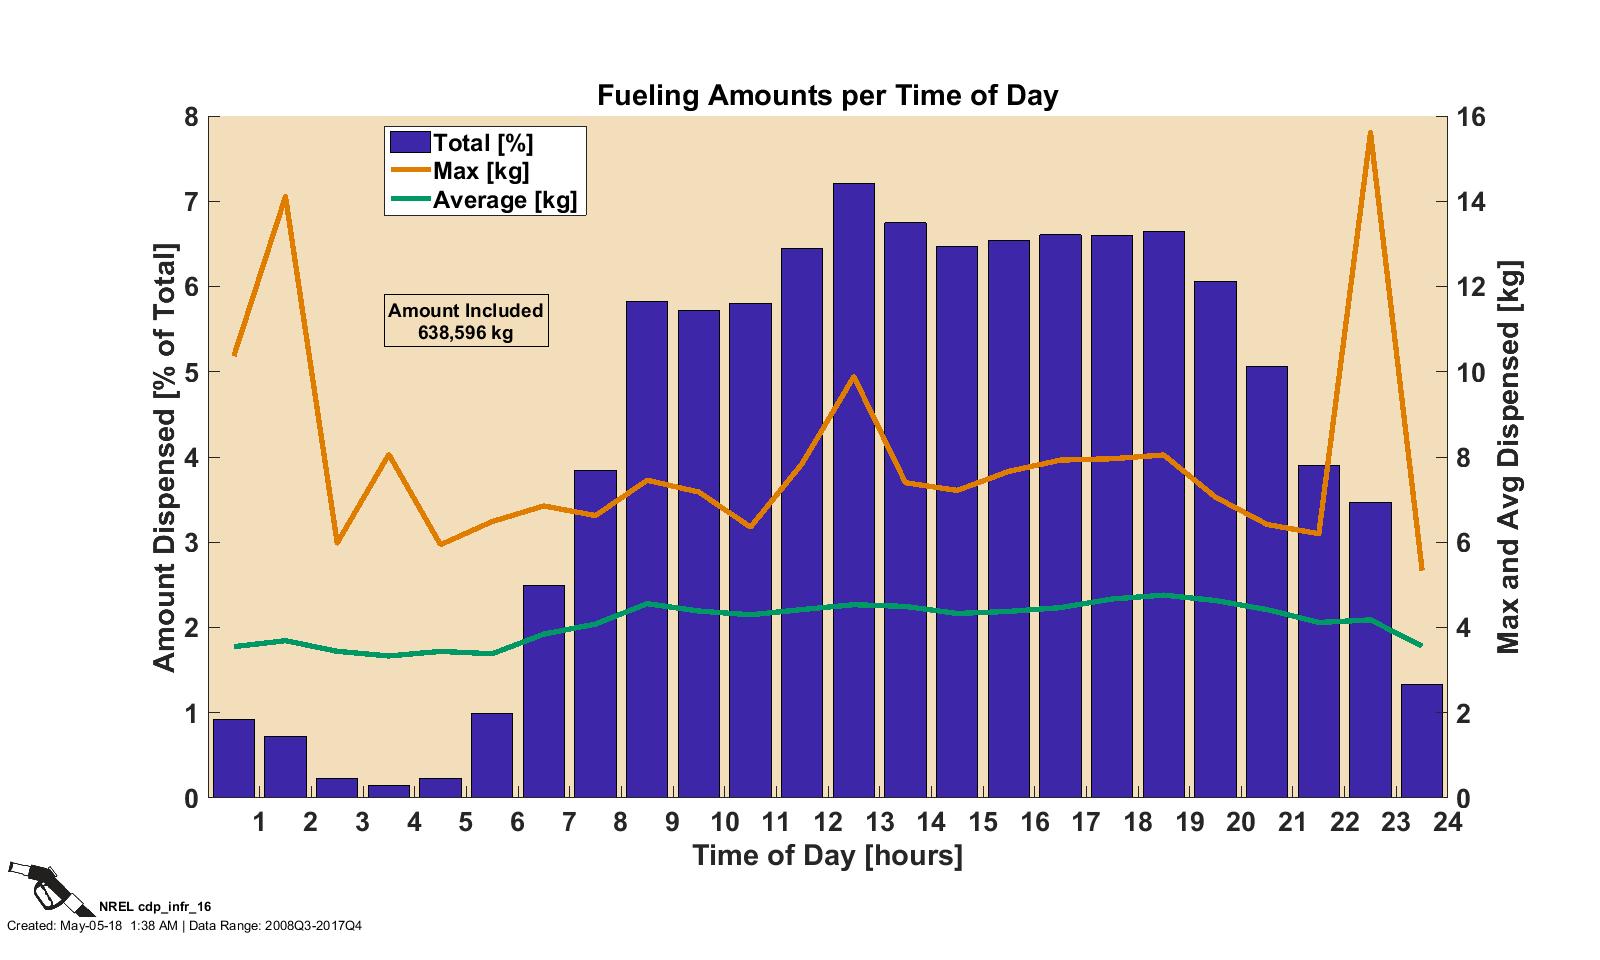
Fueling Amounts per Time of Day
CDP INFR 16, 5/5/18
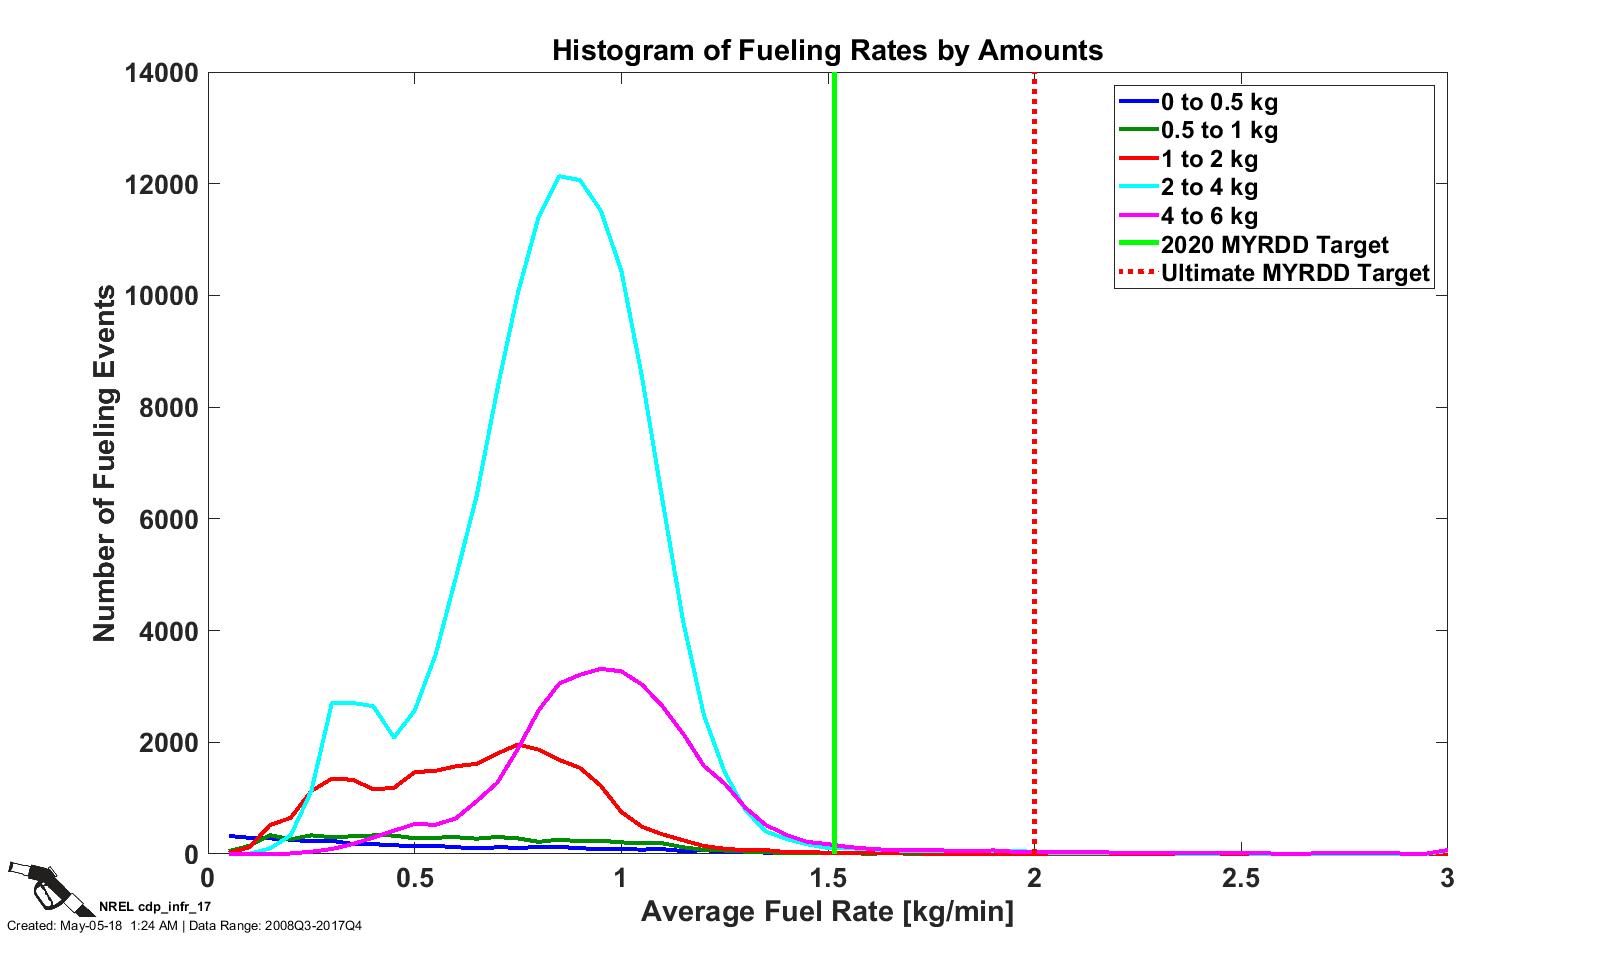
Fueling Rates by Amount Filled
CDP INFR 17, 5/5/18
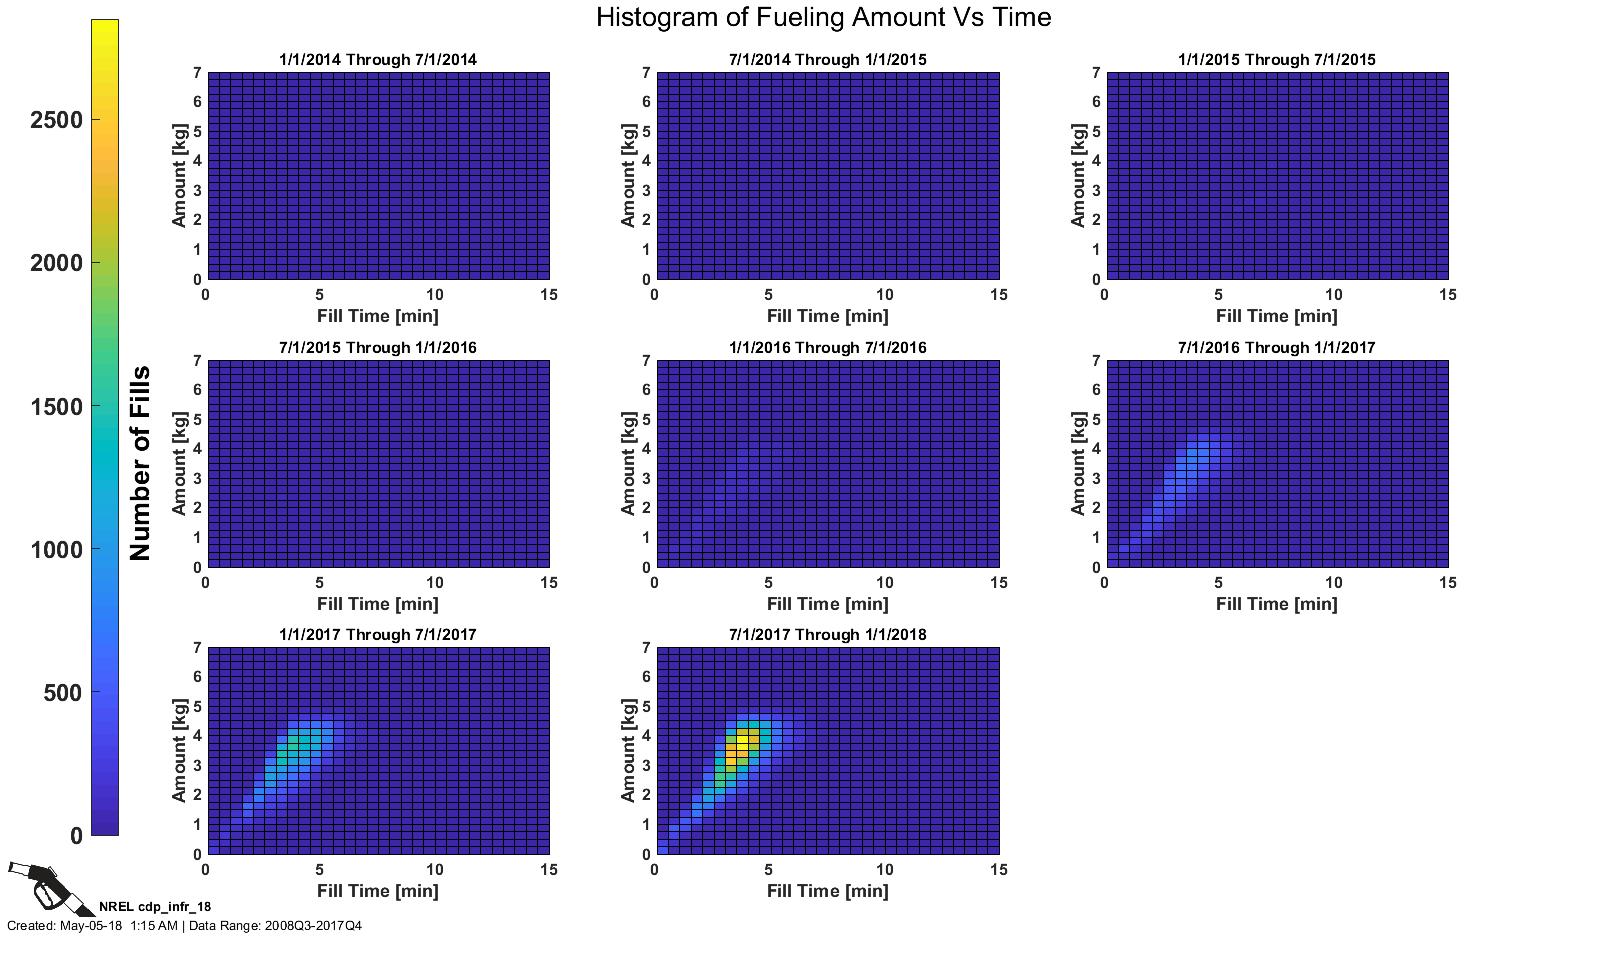
Fueling Amount vs. Time to Fill
CDP INFR 18, 5/5/18
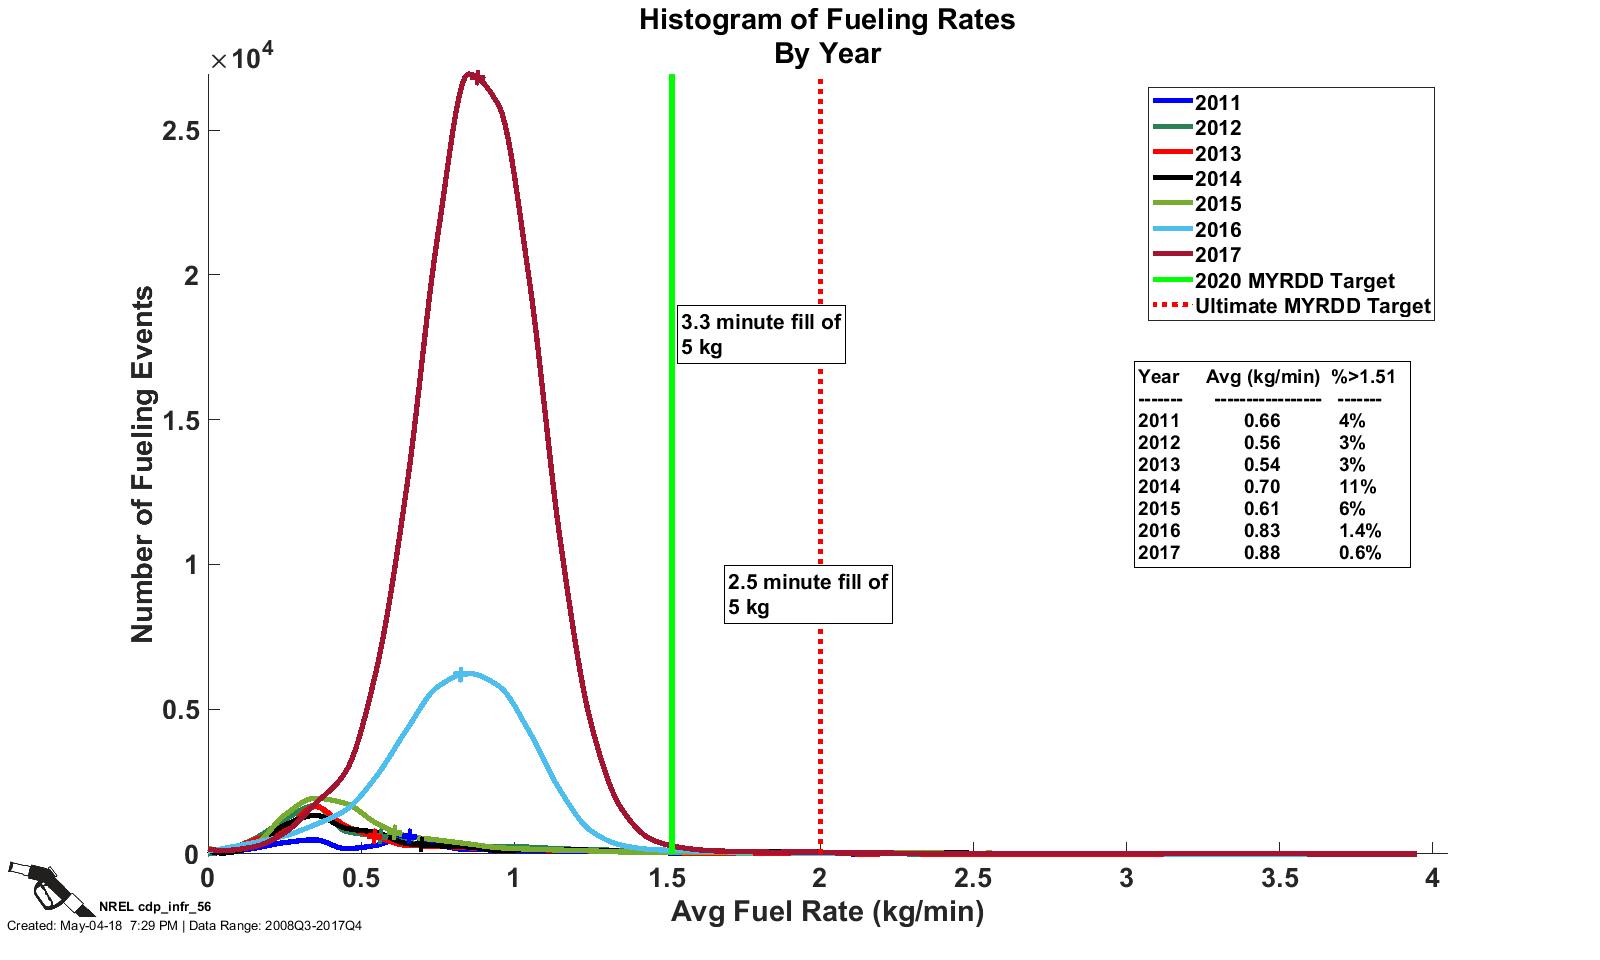
Fueling Rates by Year
CDP INFR 56, 5/4/18
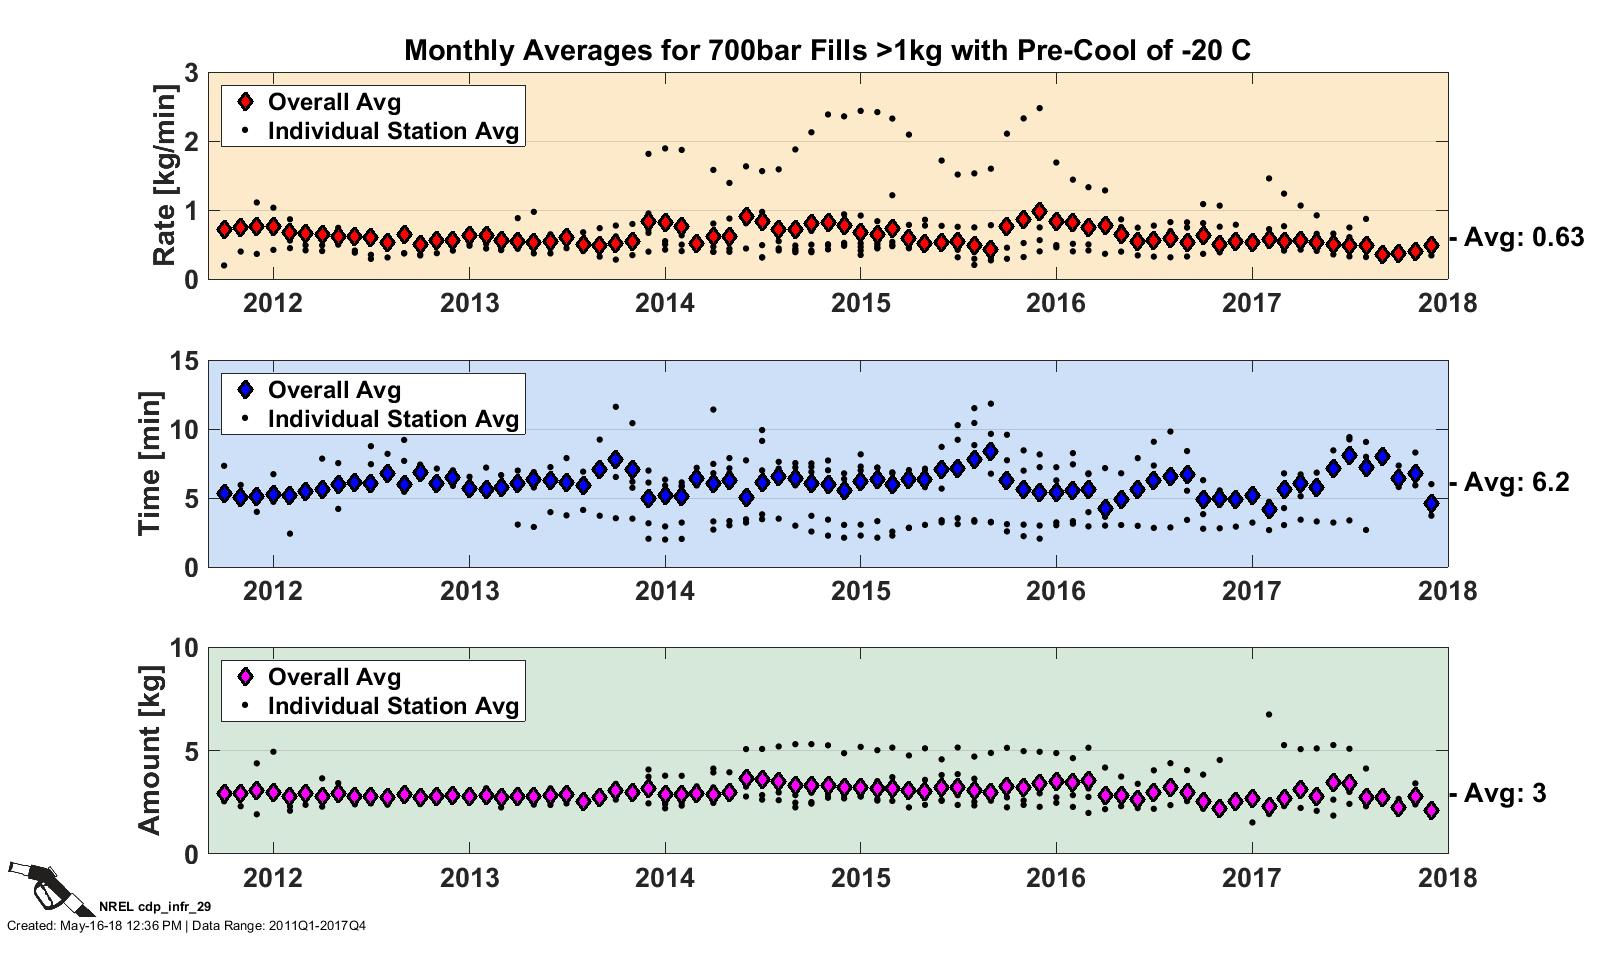
Monthly Averages: 700 bar Fills >1 kg with Pre-Cool of -20°C
CDP INFR 29, 5/16/18
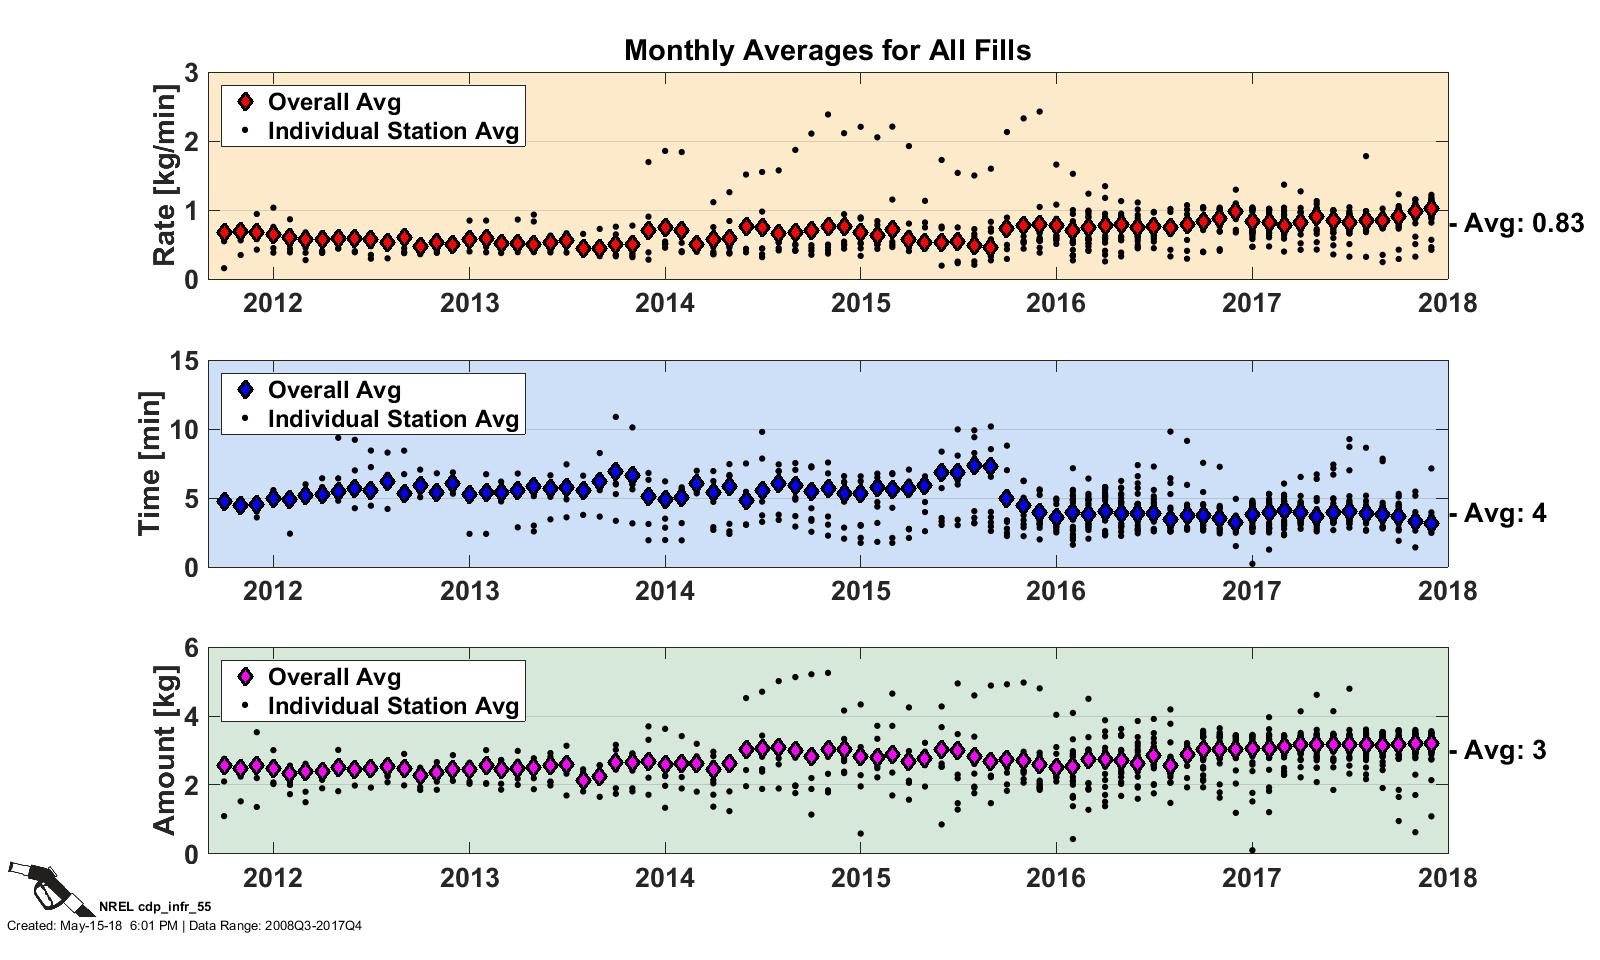
Monthly Averages: All Fills
CDP INFR 55, 5/15/18
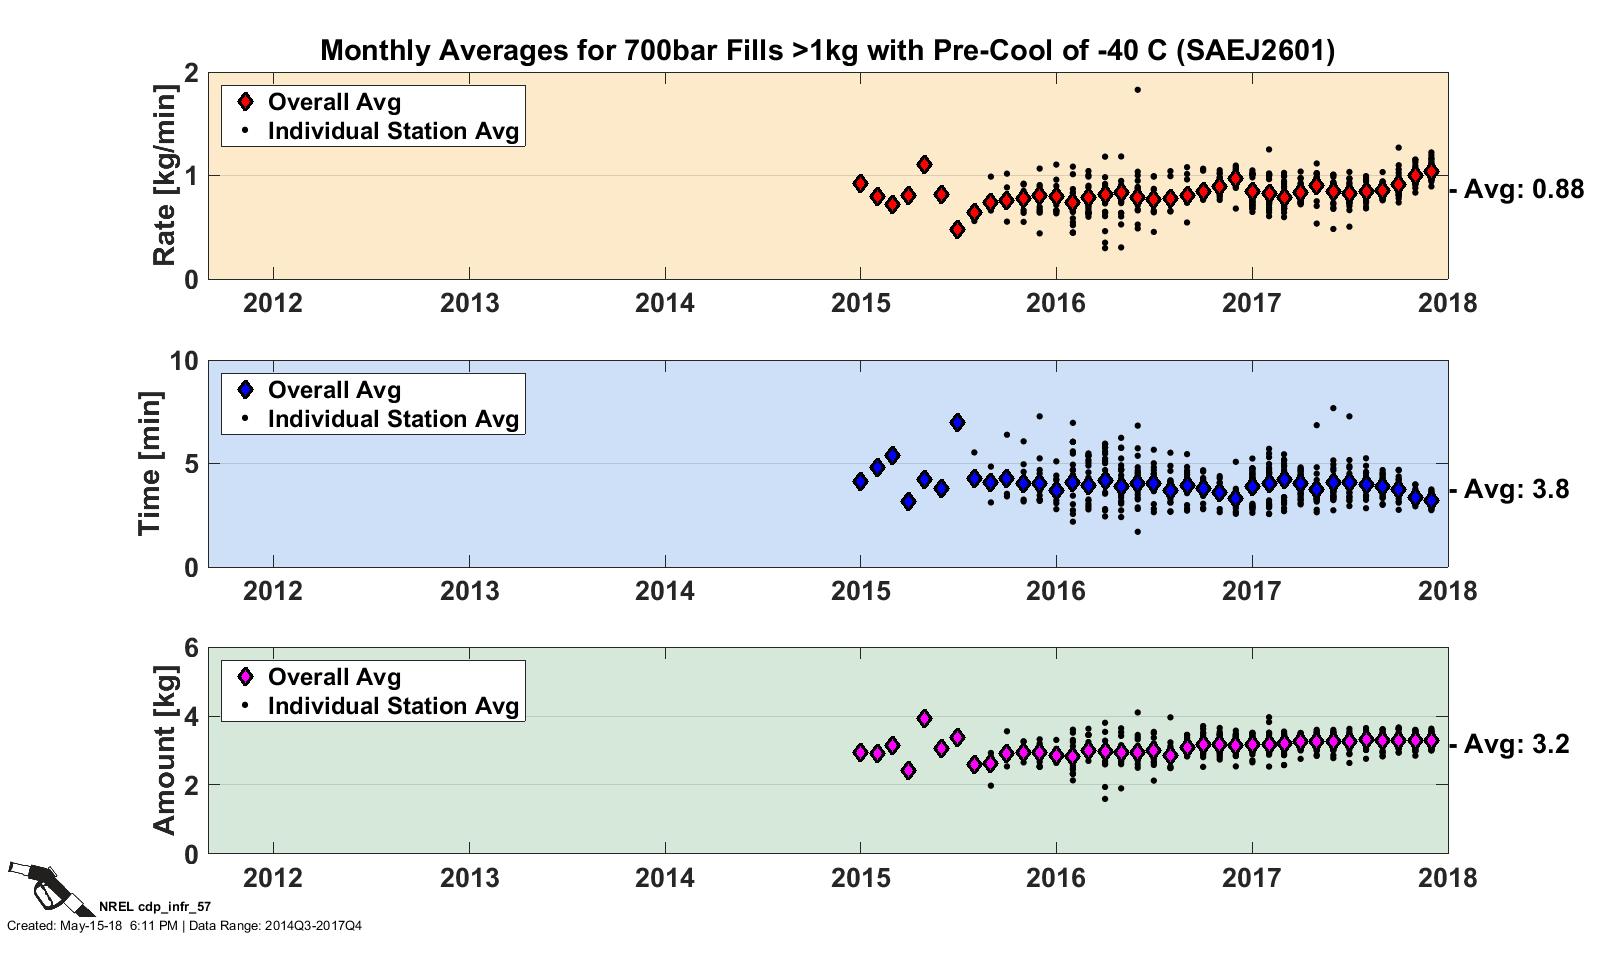
Monthly Averages: 700 bar Fills >1 kg with Pre-Cool of -40°C
CDP INFR 57, 5/15/18
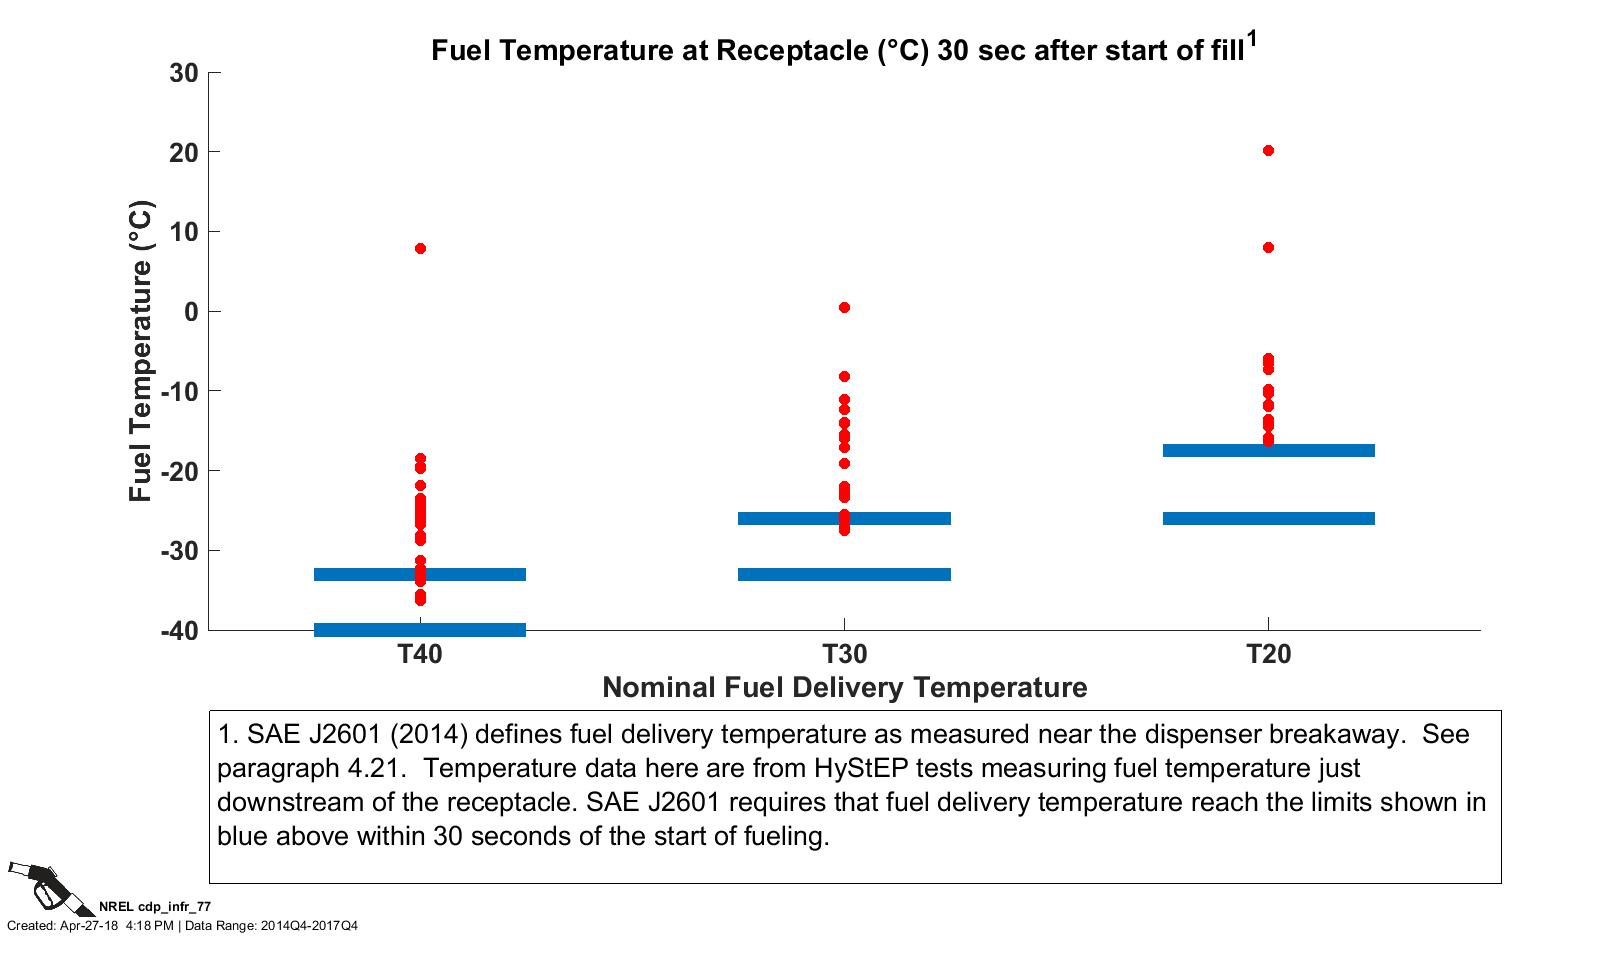
Fuel Temperature at Receptacle 30 s After Start of Fill
CDP INFR 77, 4/27/18
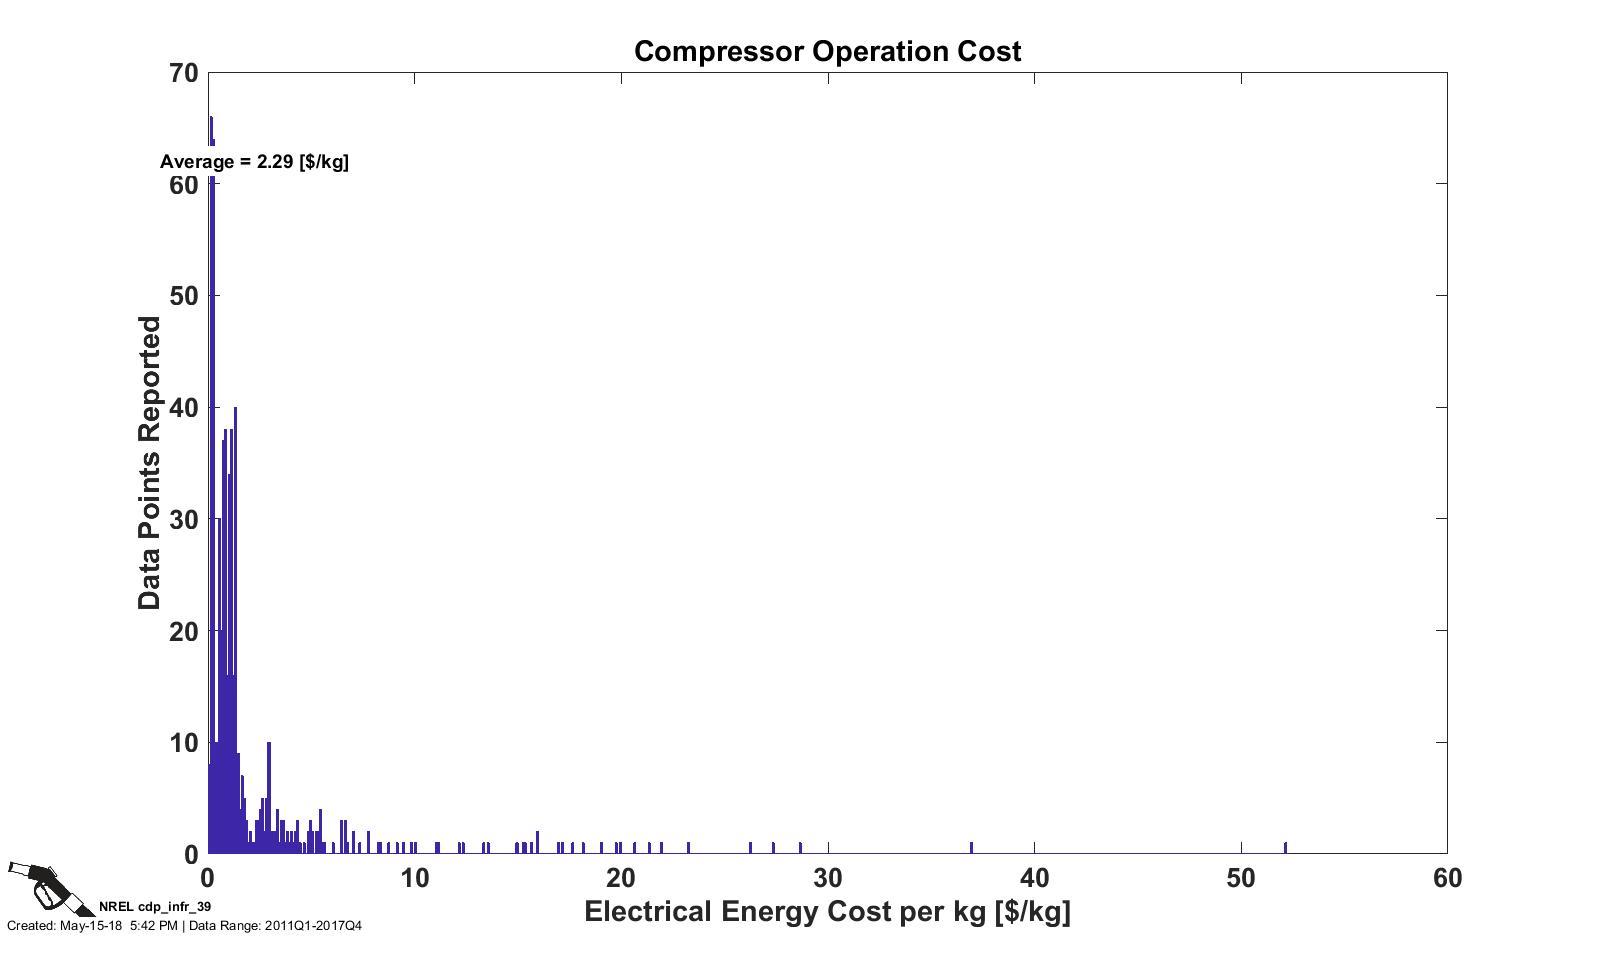
Compressor Operation Cost
CDP INFR 39, 5/15/18
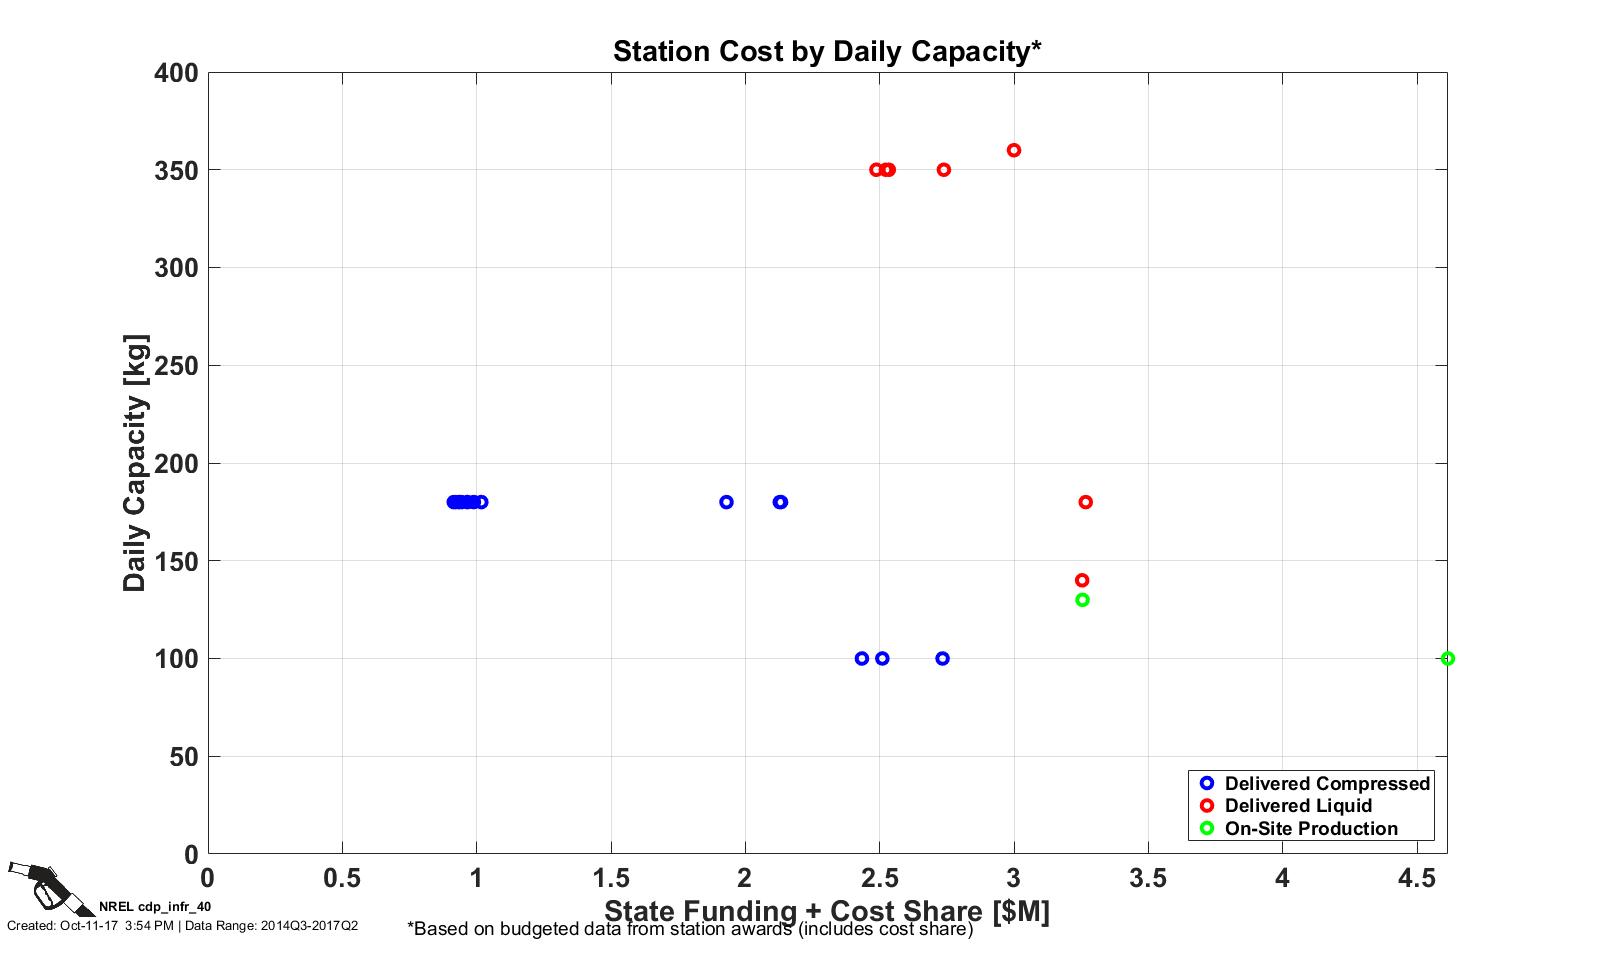
Station Cost by Daily Capacity
CDP INFR 40, 10/11/17
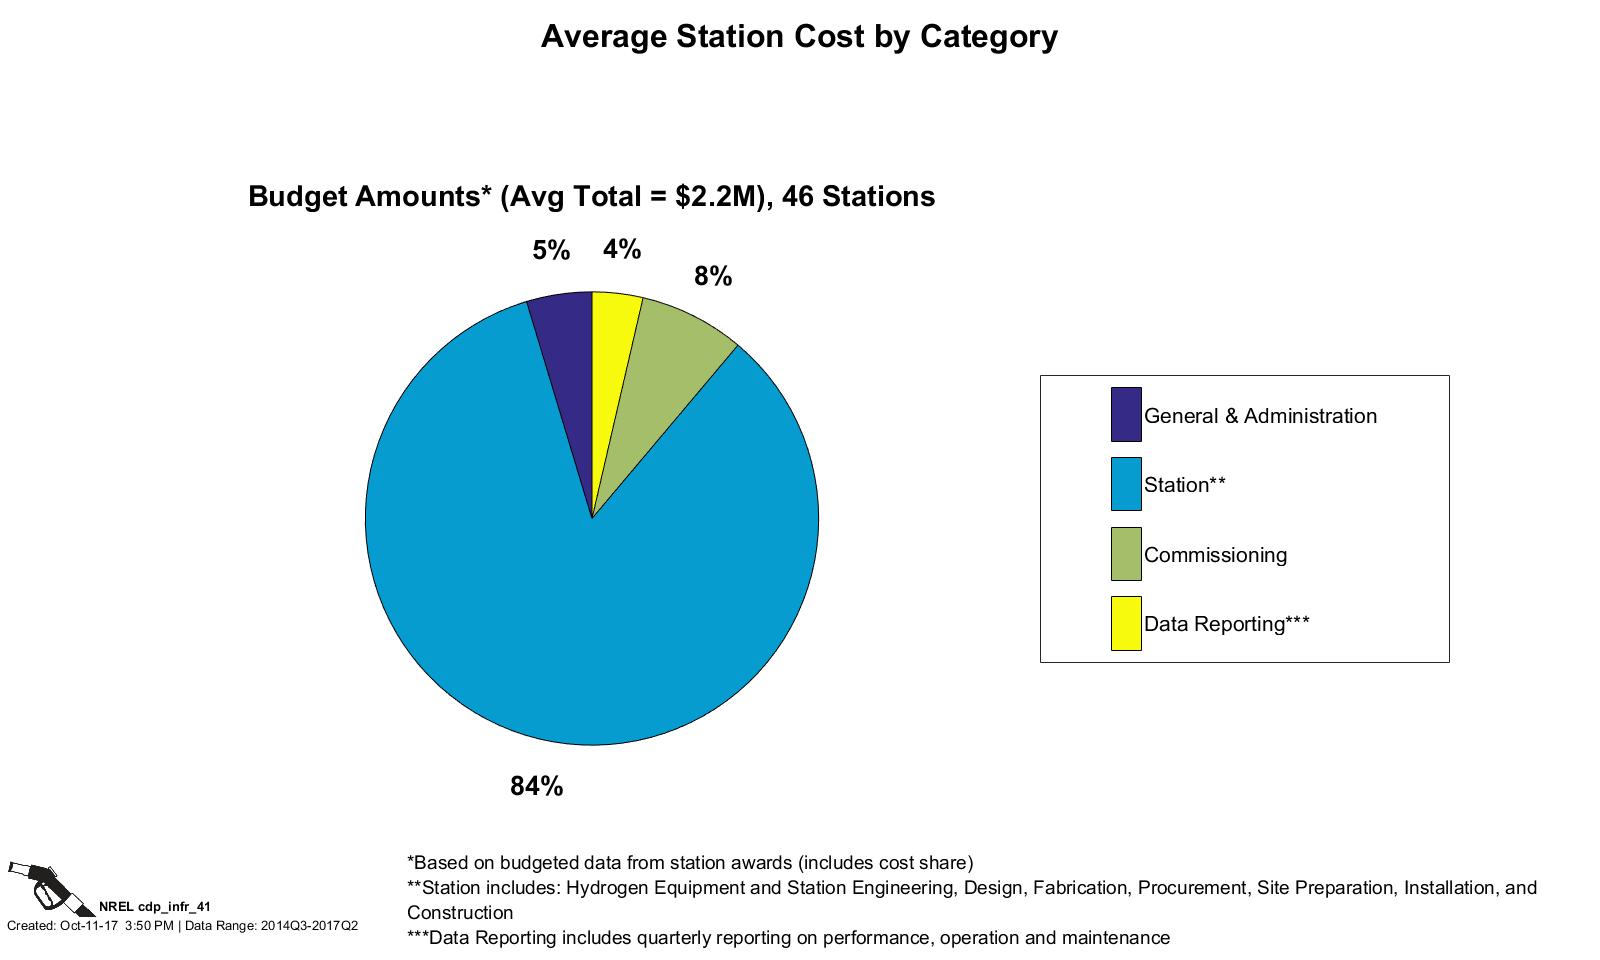
Average Station Cost by Category
CDP INFR 41, 10/11/17
Station Cost
CDP INFR 42, 10/11/17
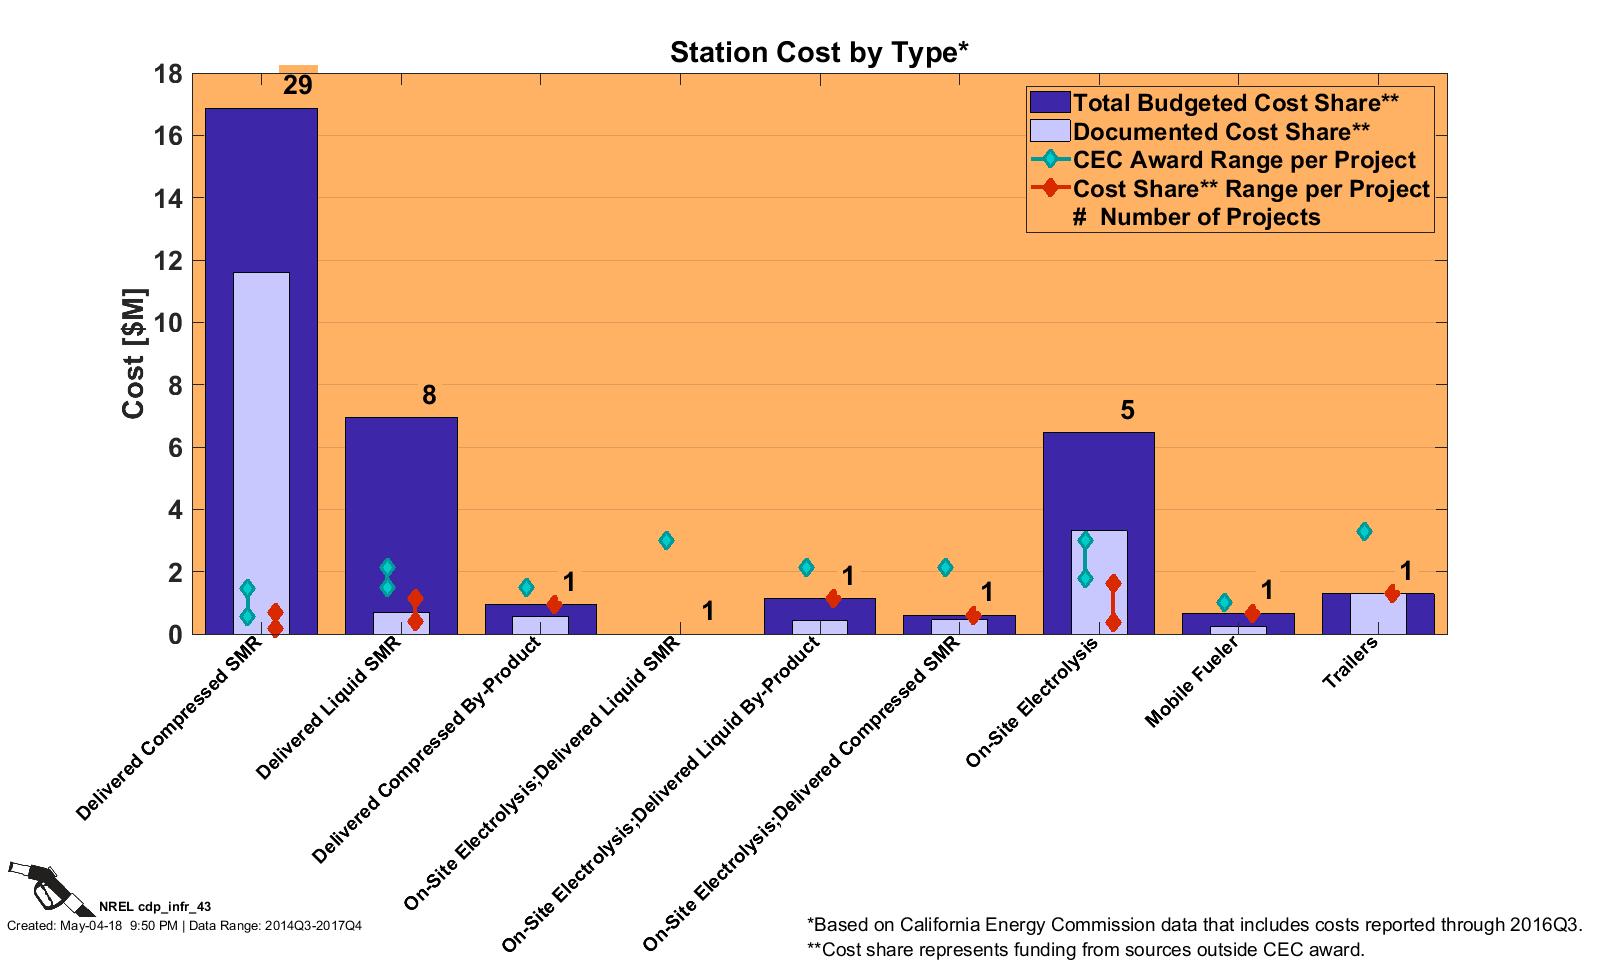
Station Cost by Type
CDP INFR 43, 5/4/18
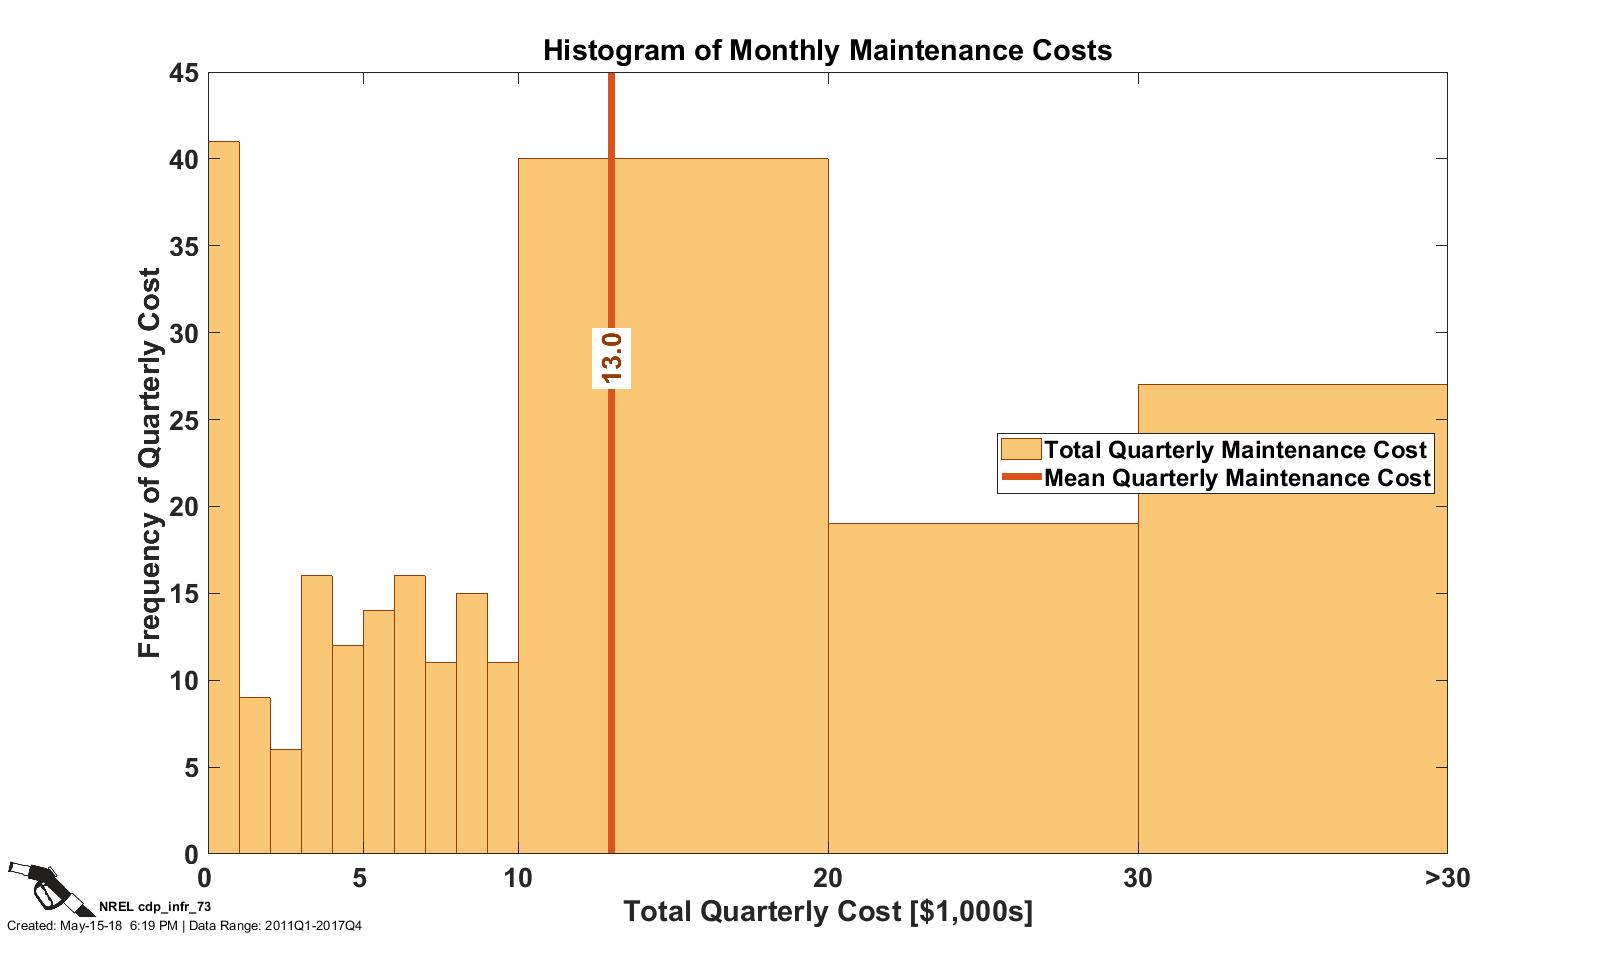
Monthly Maintenance Costs
CDP INFR 73, 5/15/18
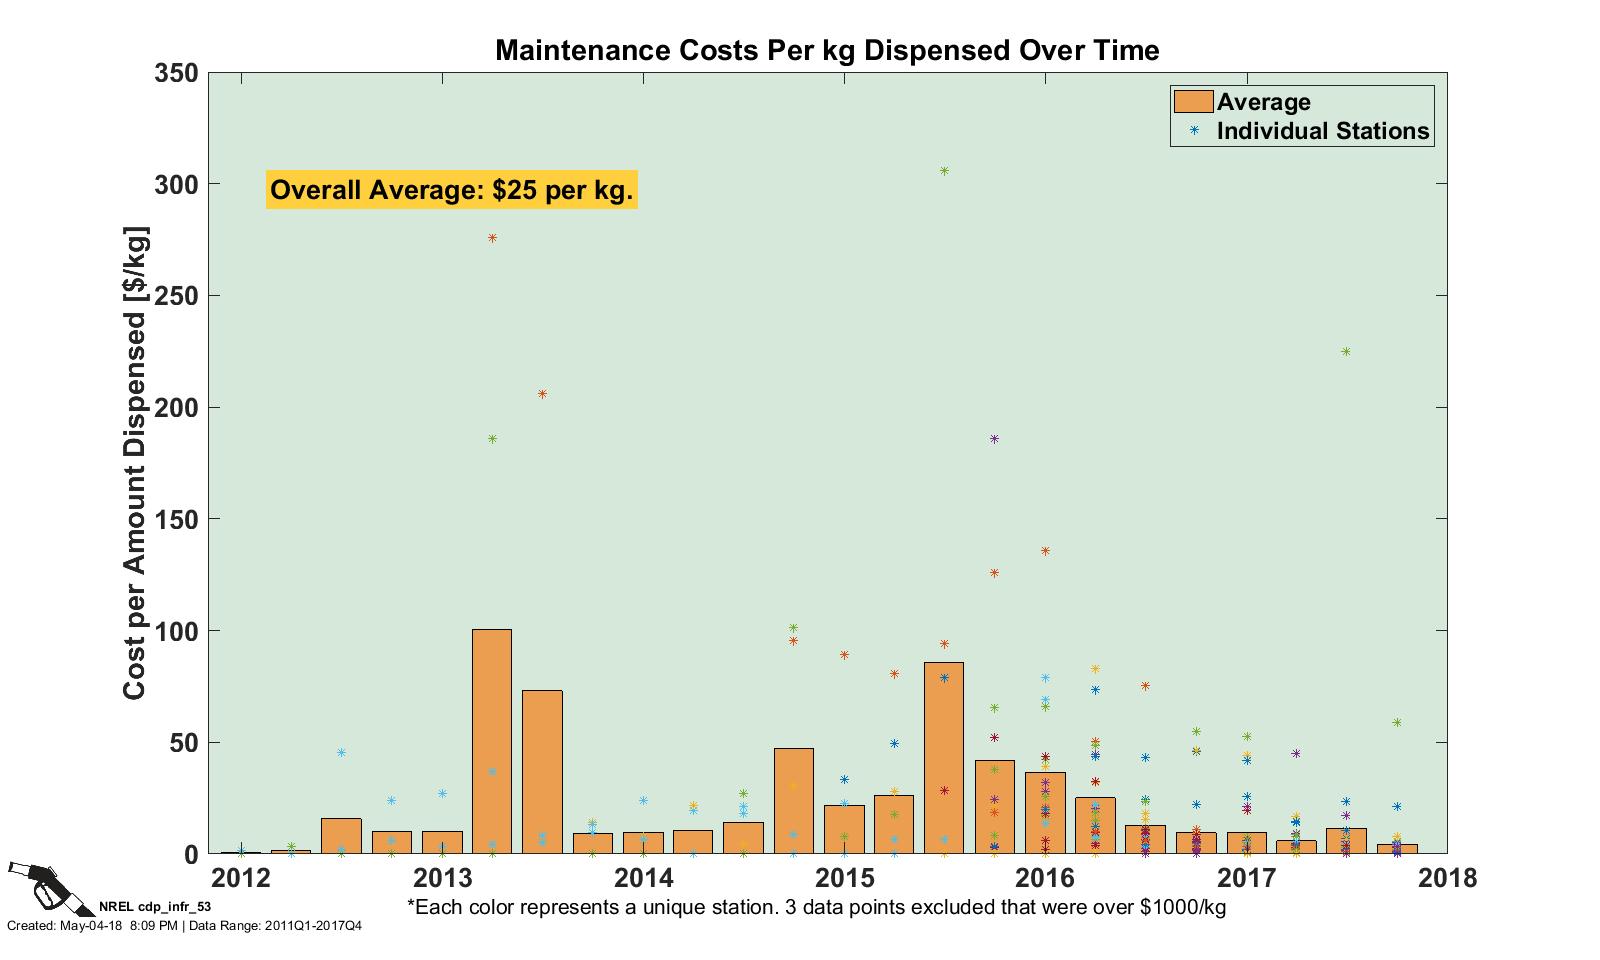
Maintenance Cost per kg of Hydrogen Dispensed
CDP INFR 53, 5/4/18
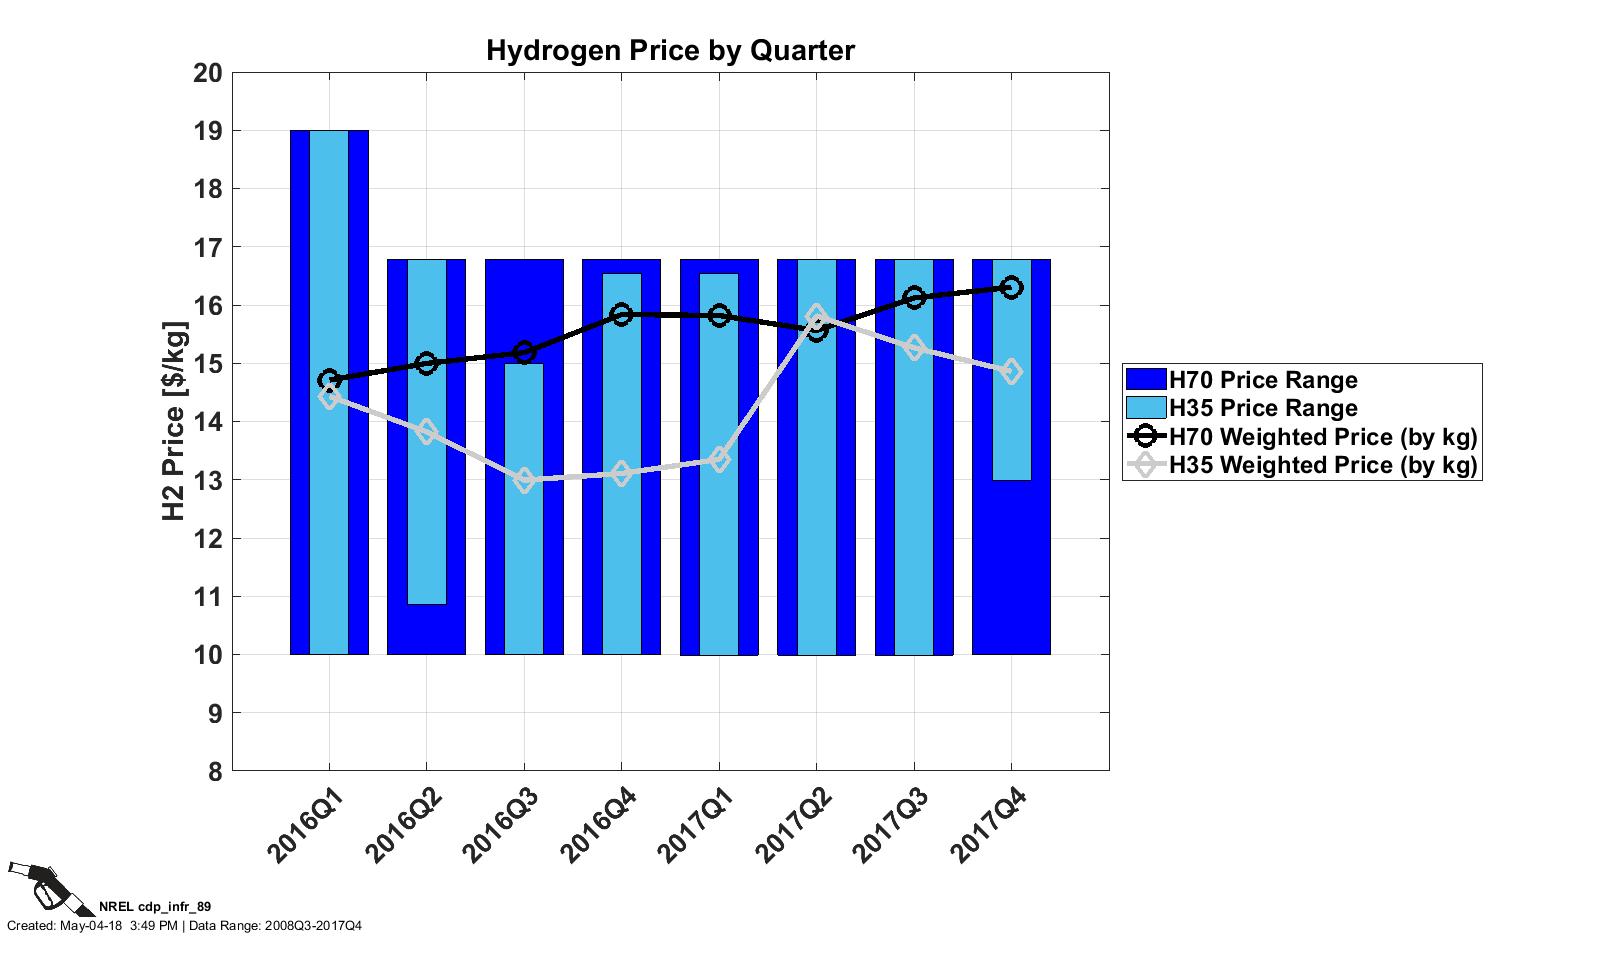
Hydrogen Price by Quarter
CDP INFR 89, 5/4/18
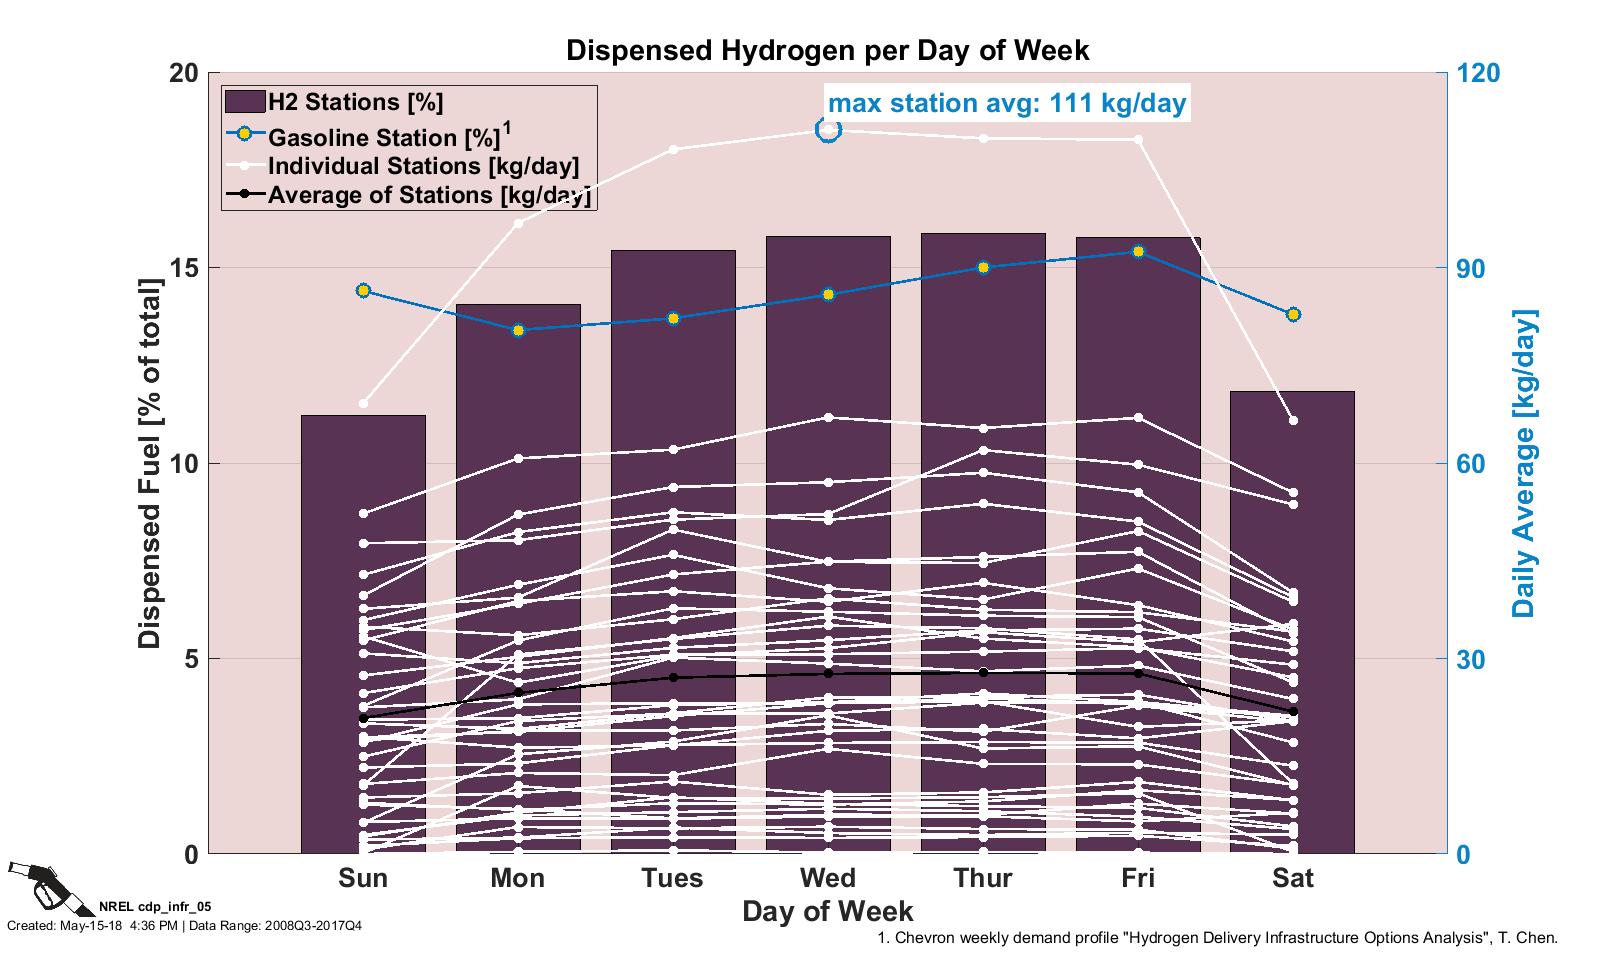
Dispensed Hydrogen per Day of Week
CDP INFR 05, 5/15/18
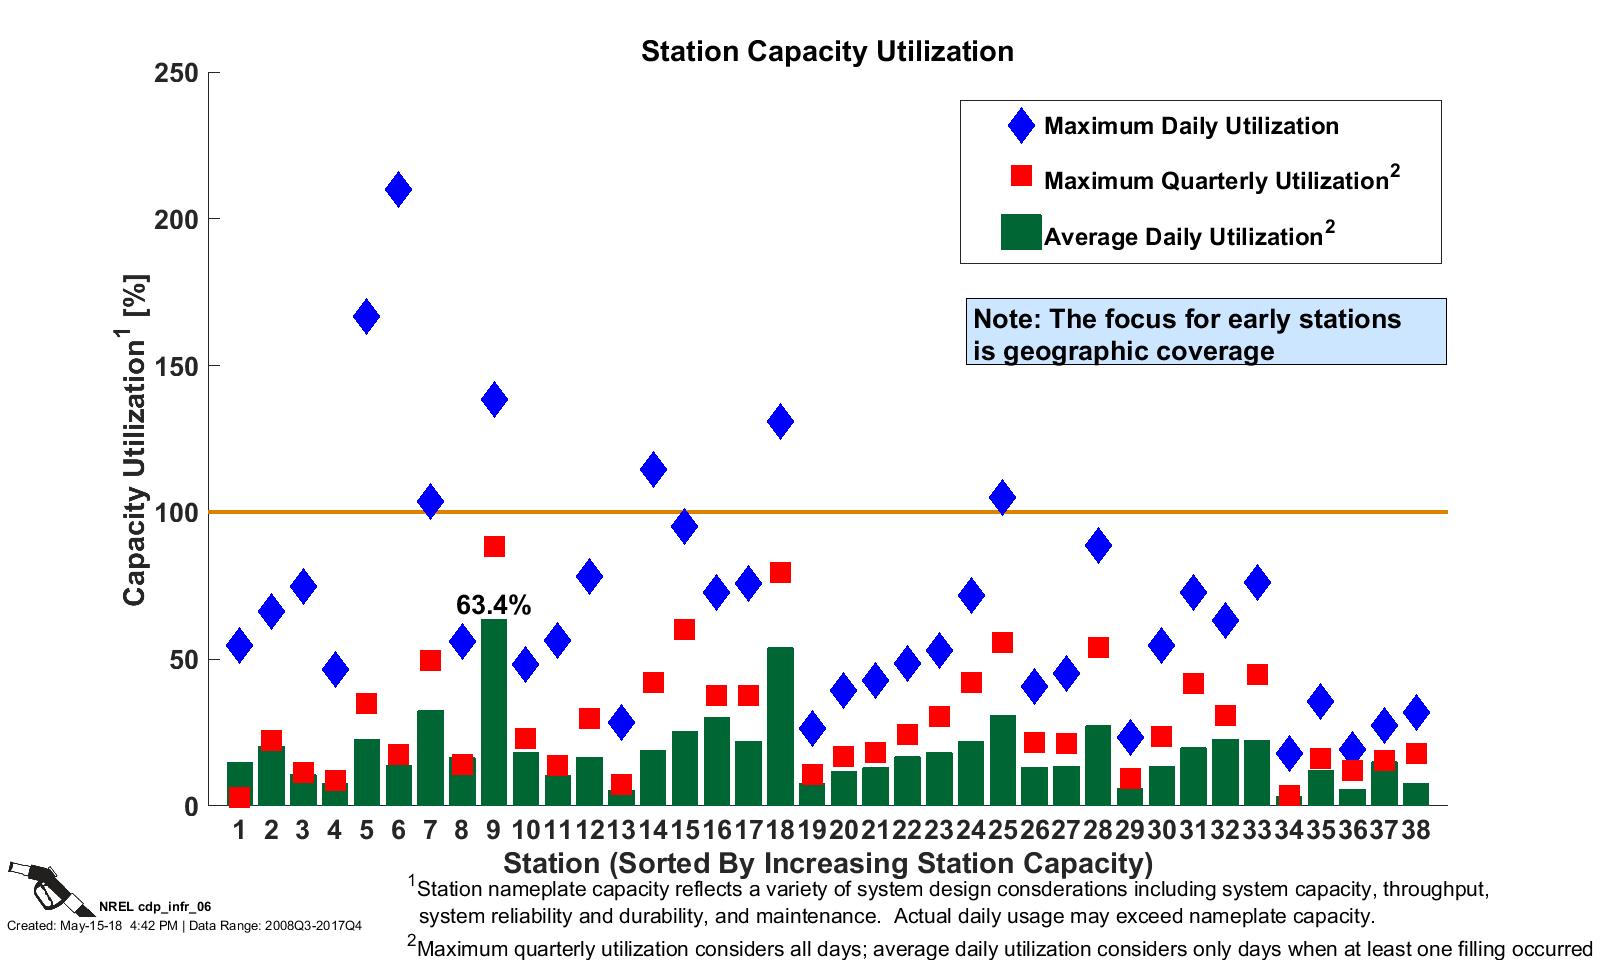
Station Capacity Utilization
CDP INFR 06, 5/15/18
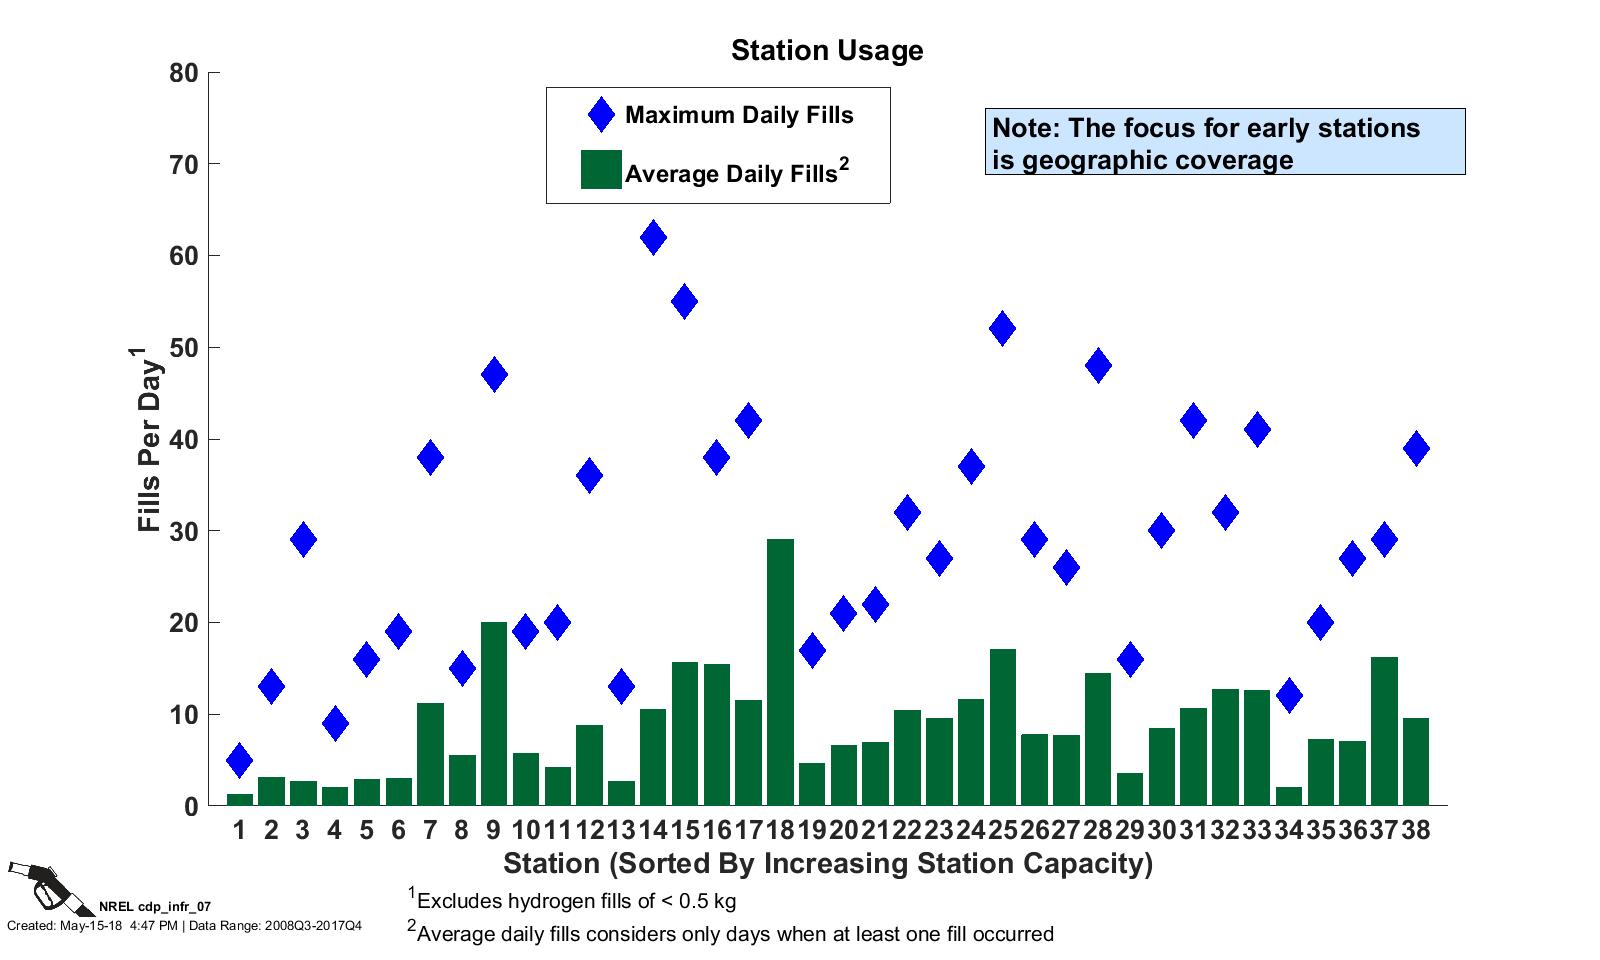
Station Usage
CDP INFR 07, 5/15/18
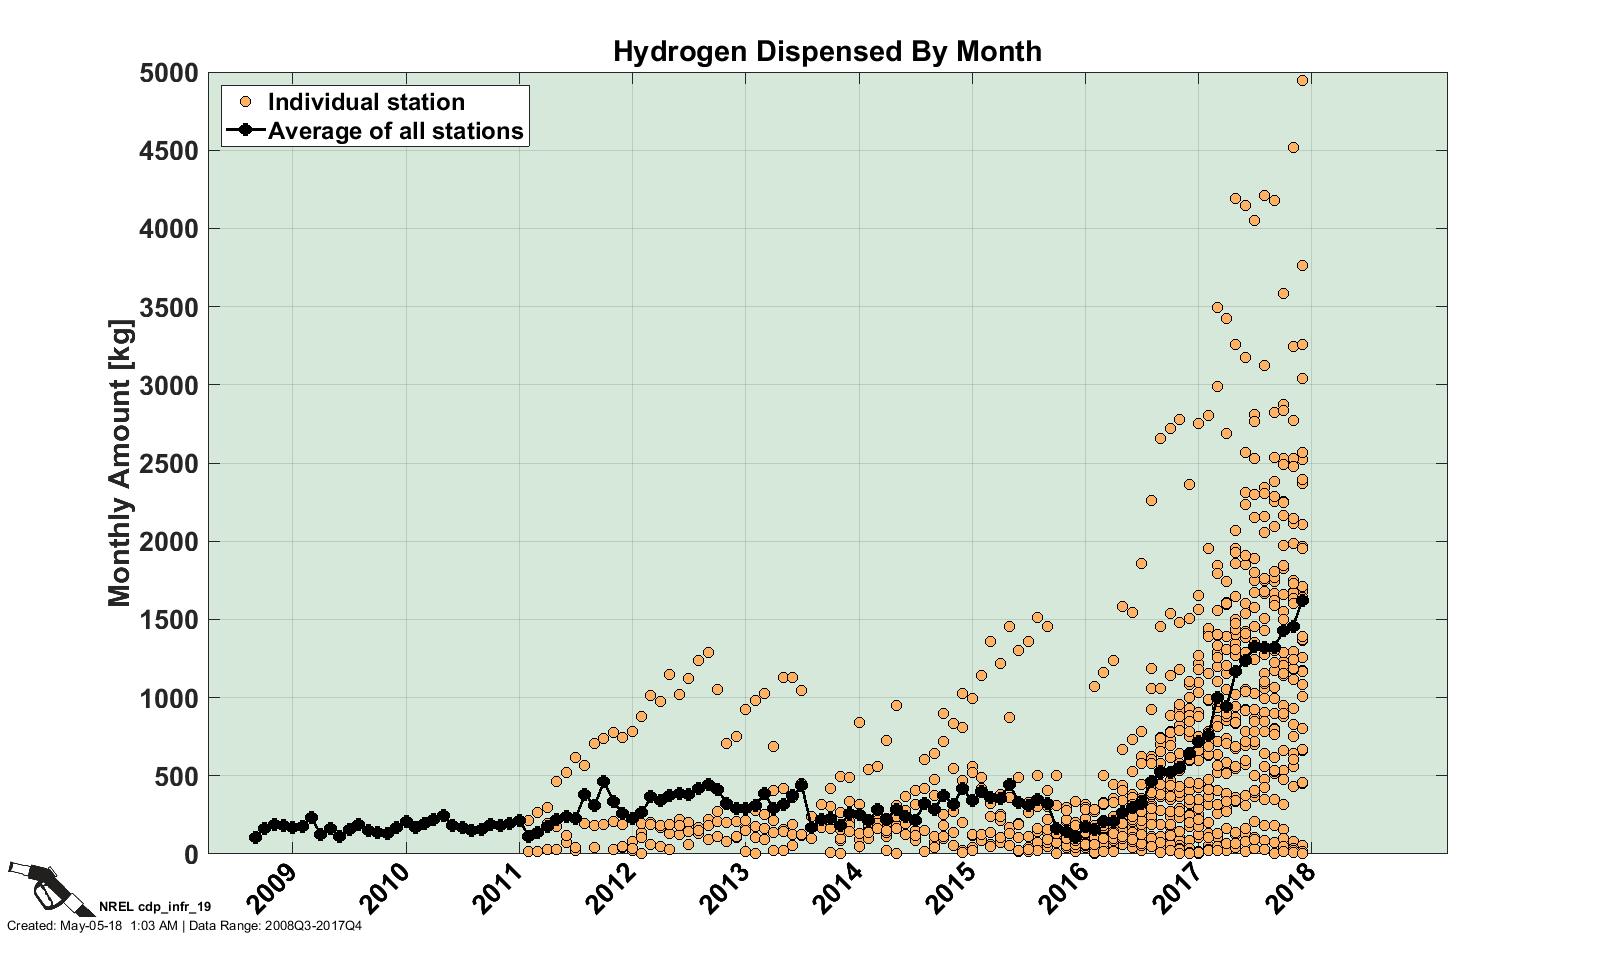
Hydrogen Dispensed by Month
CDP INFR 19, 5/5/18
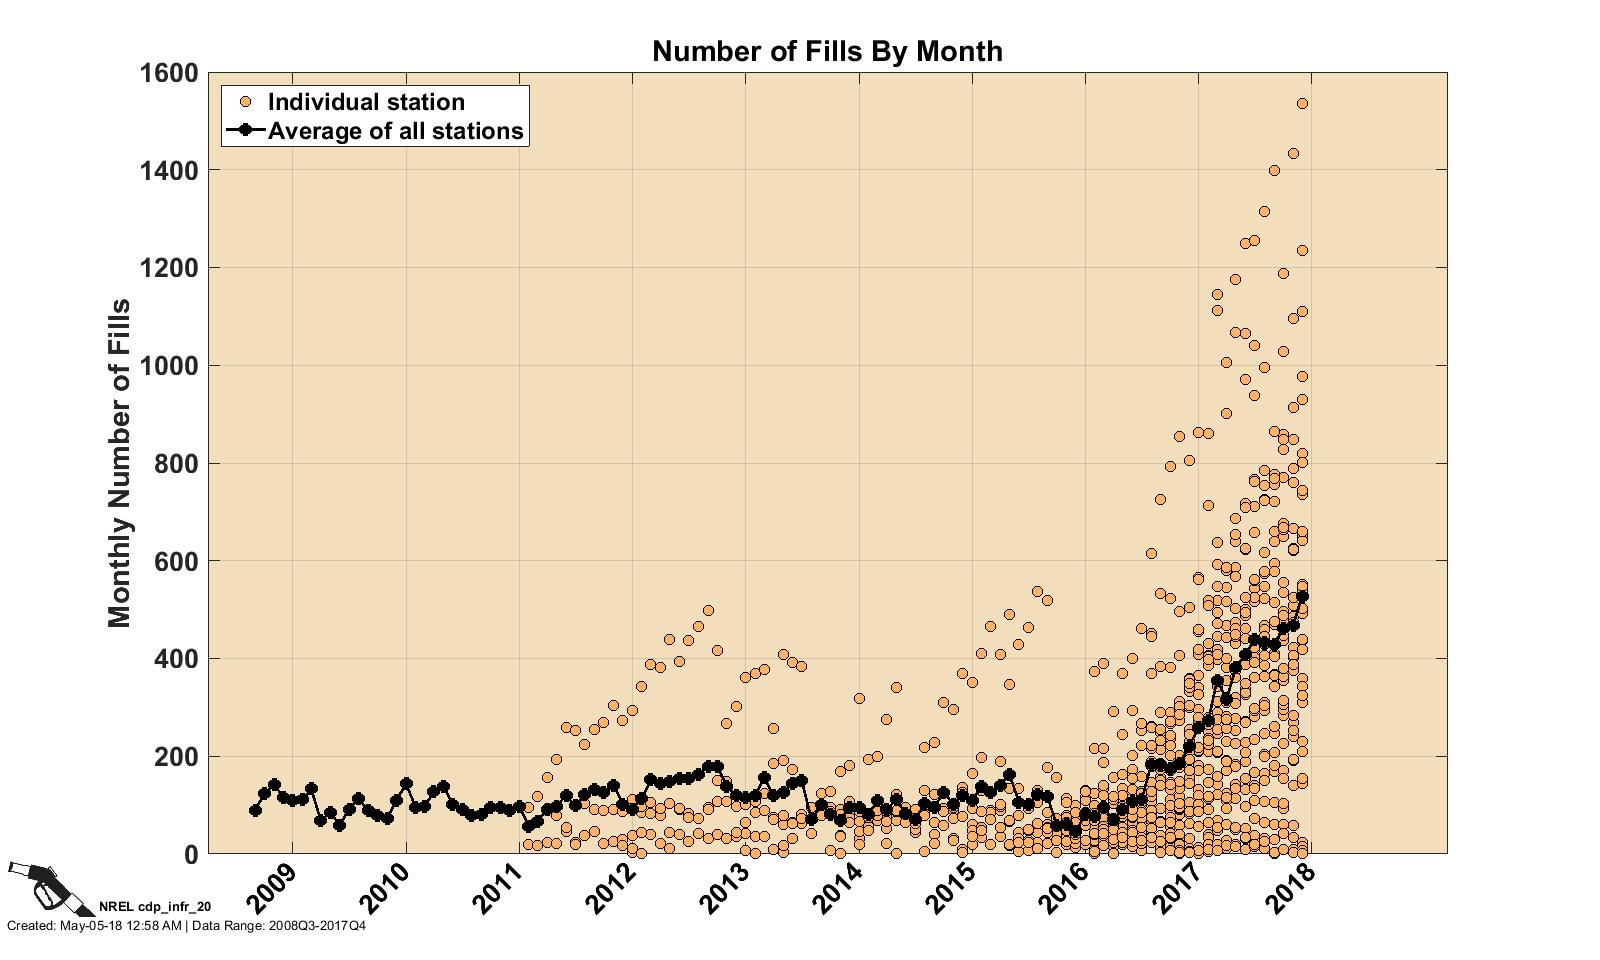
Number of Fills by Month
CDP INFR 20, 5/5/18
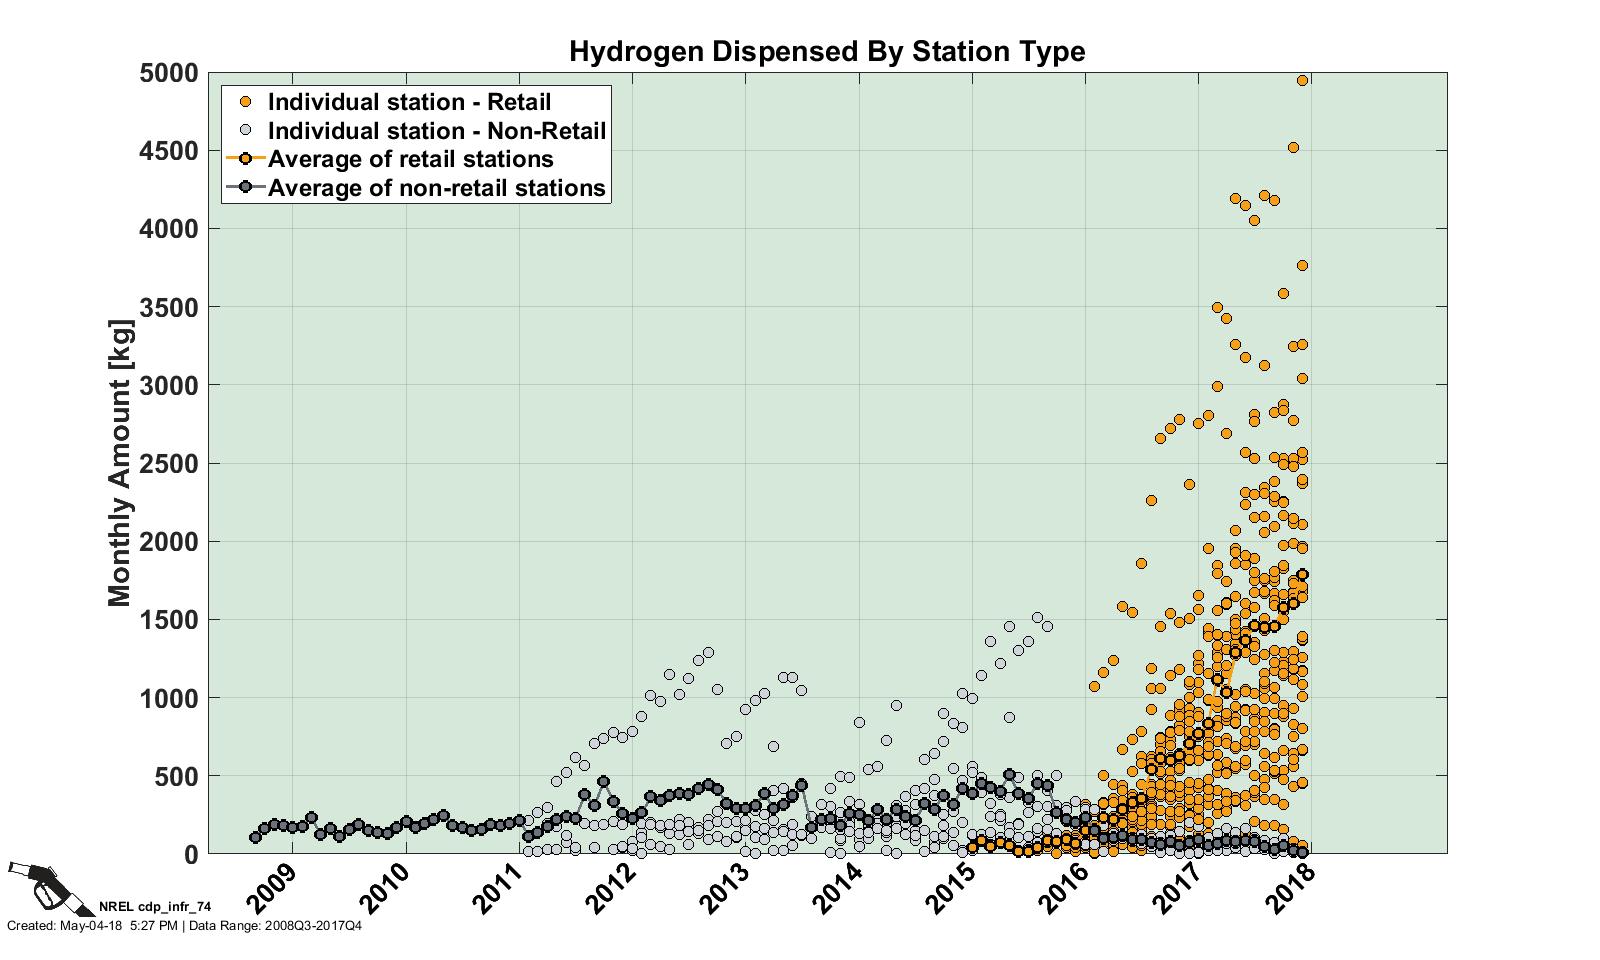
Hydrogen Dispensed by Station Type
CDP INFR 74, 5/4/18
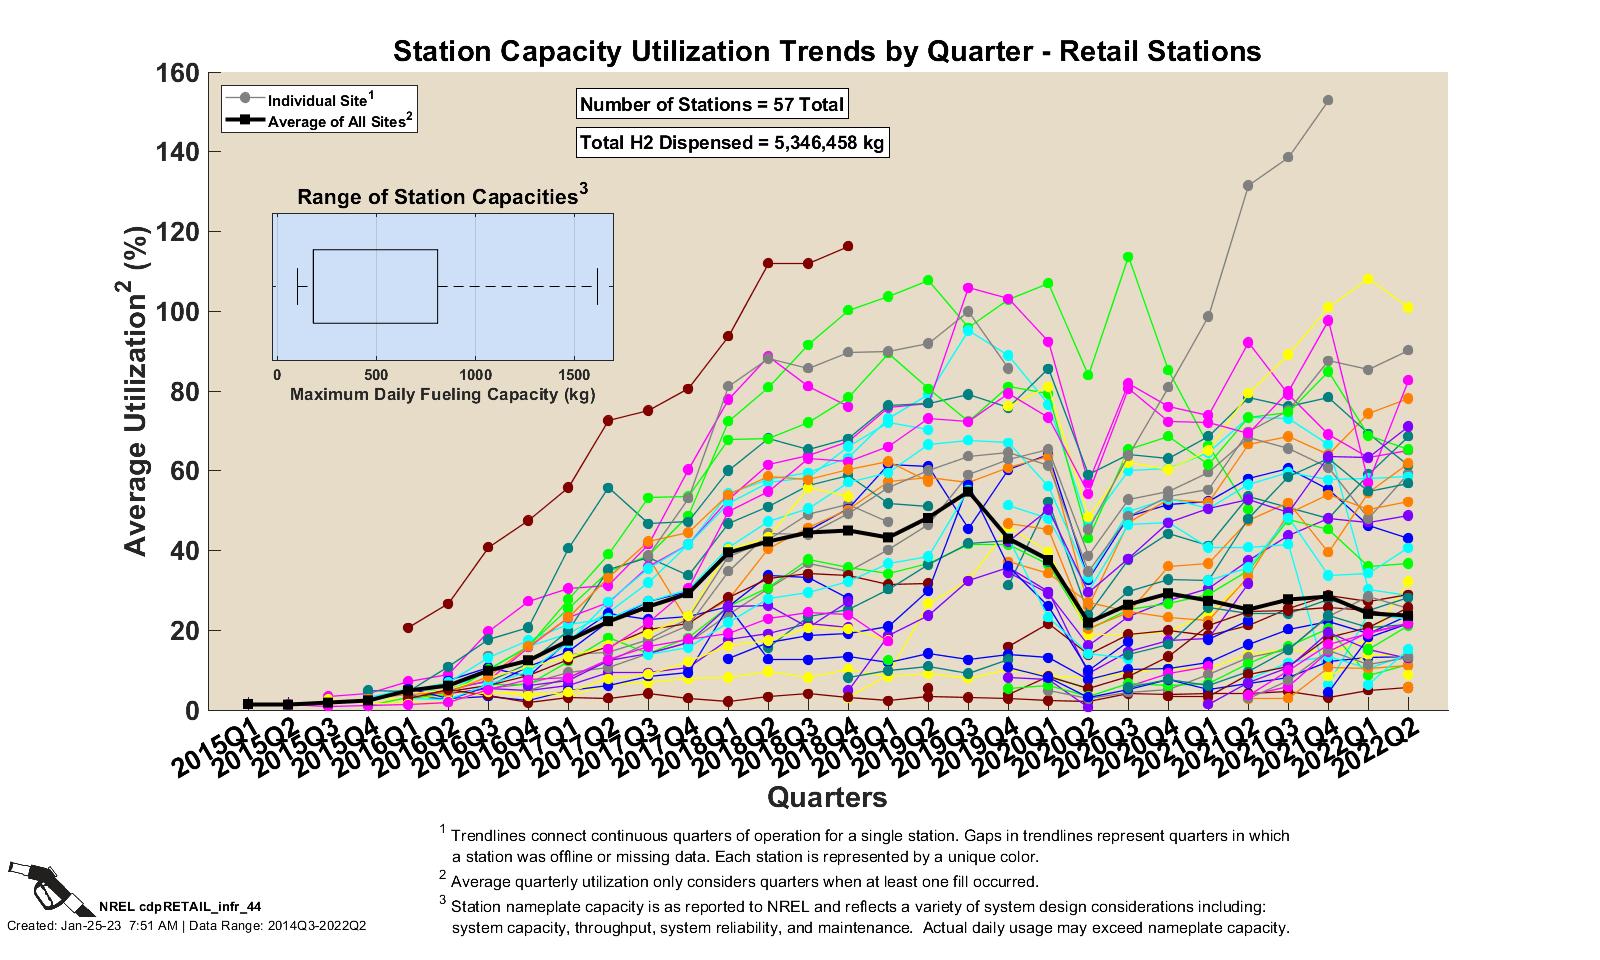
Station Capacity Utilization Trends by Quarter
CDP INFR 44, 5/7/18
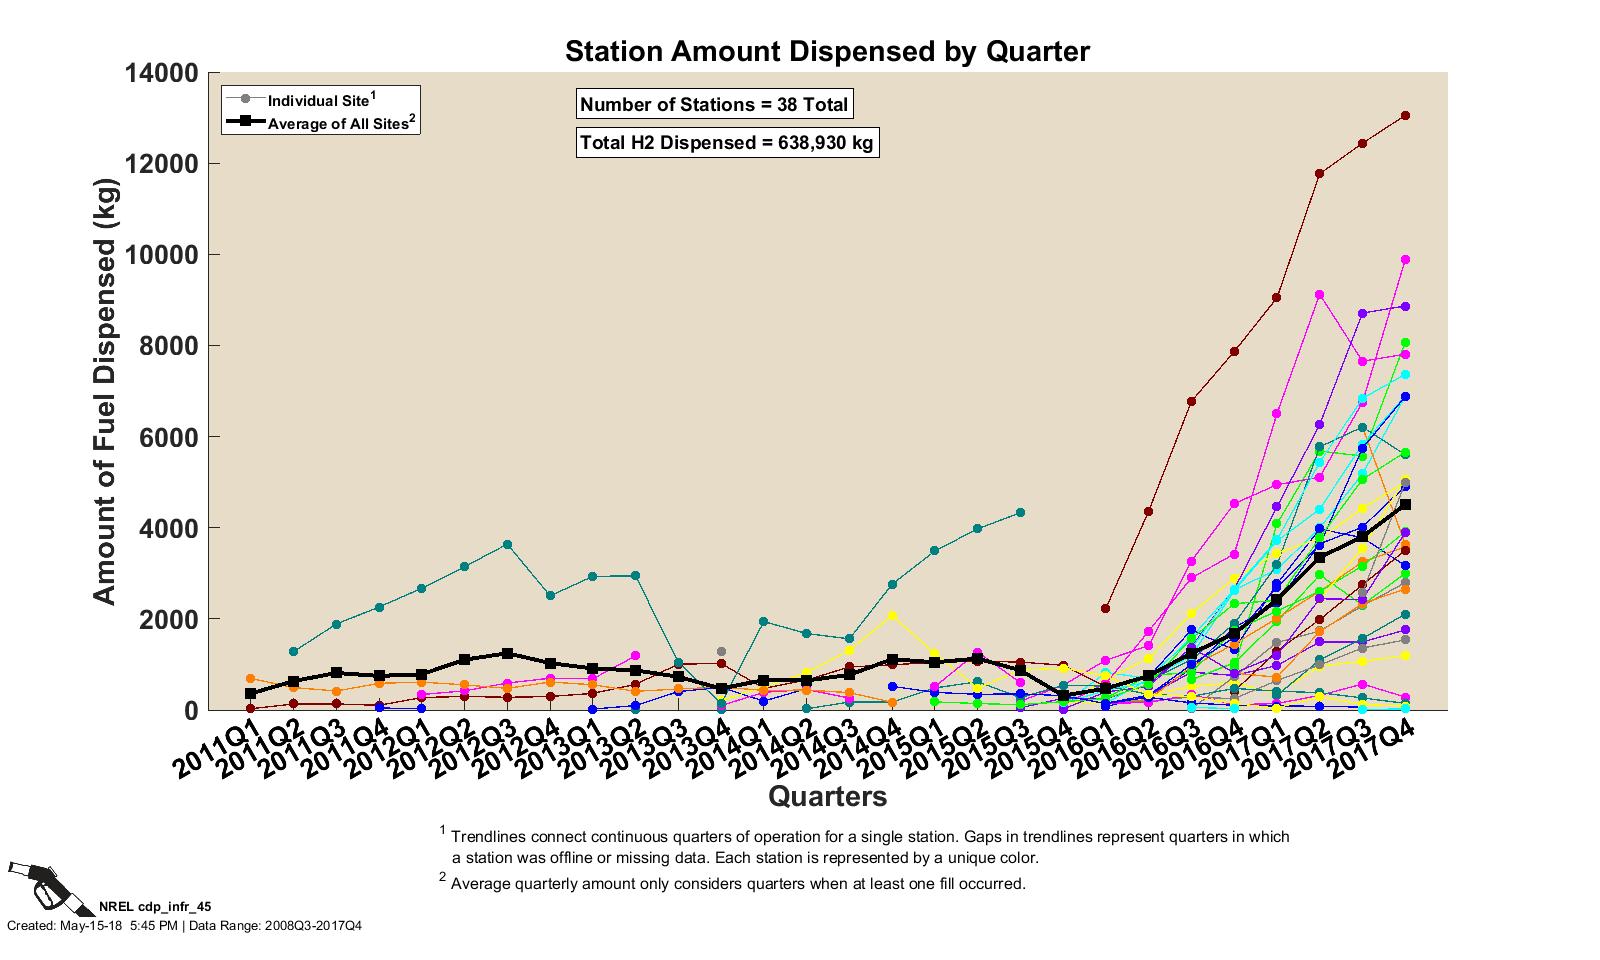
Station Amount Dispensed by Quarter
CDP INFR 45, 5/15/18
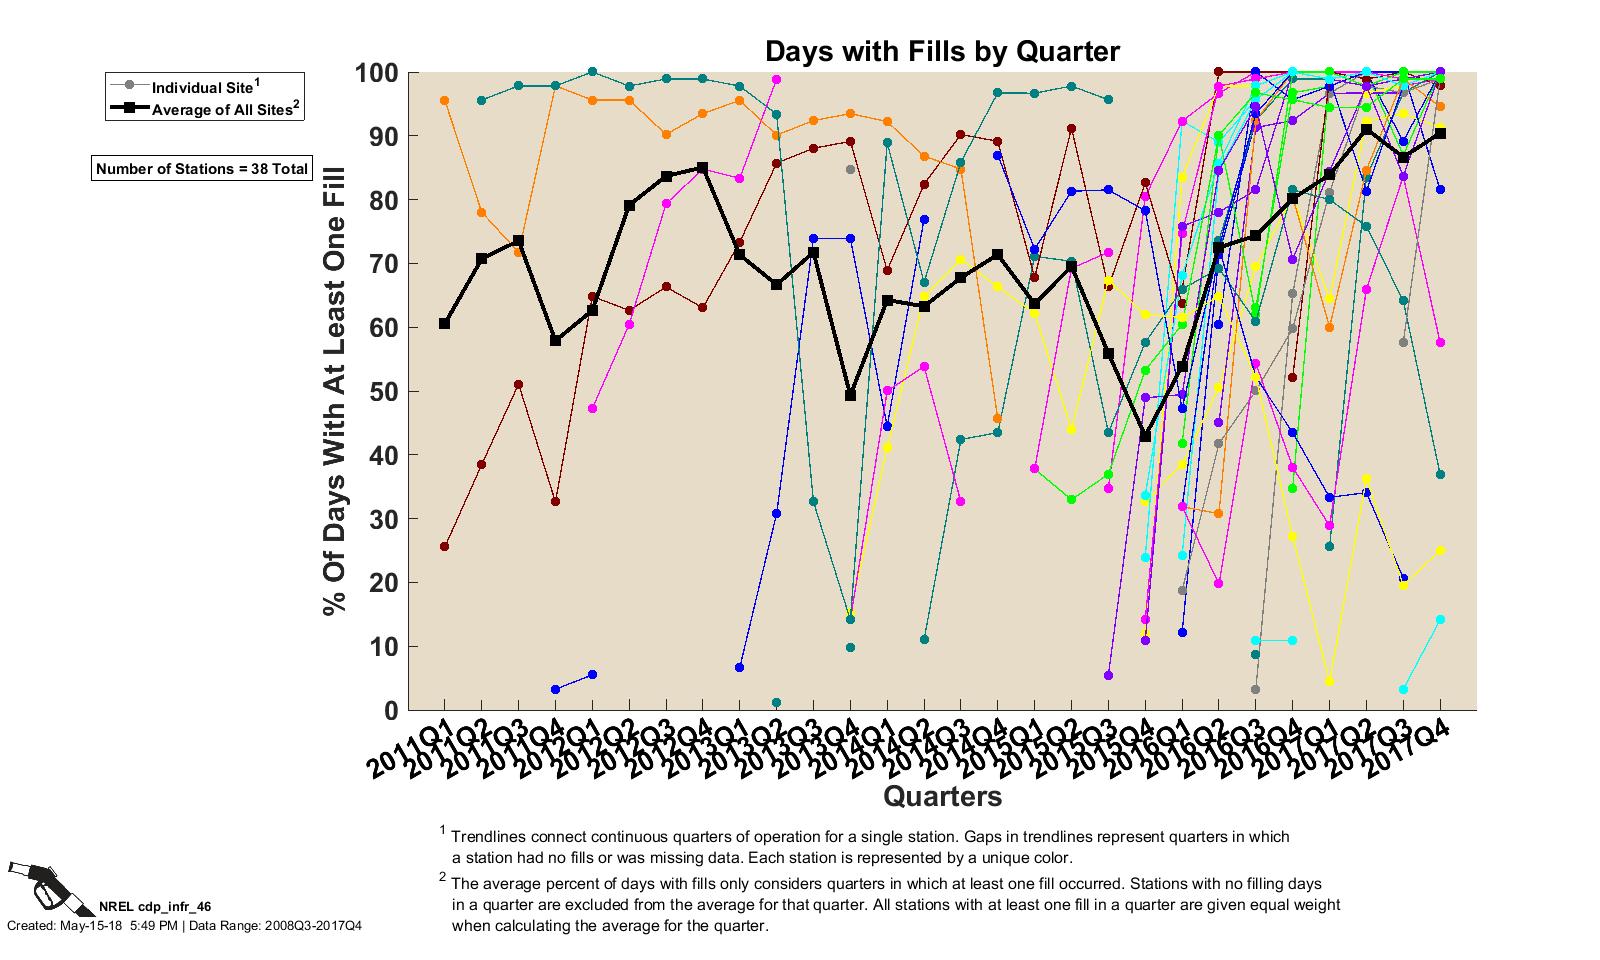
Days with Fills by Quarter
CDP INFR 46, 5/15/18
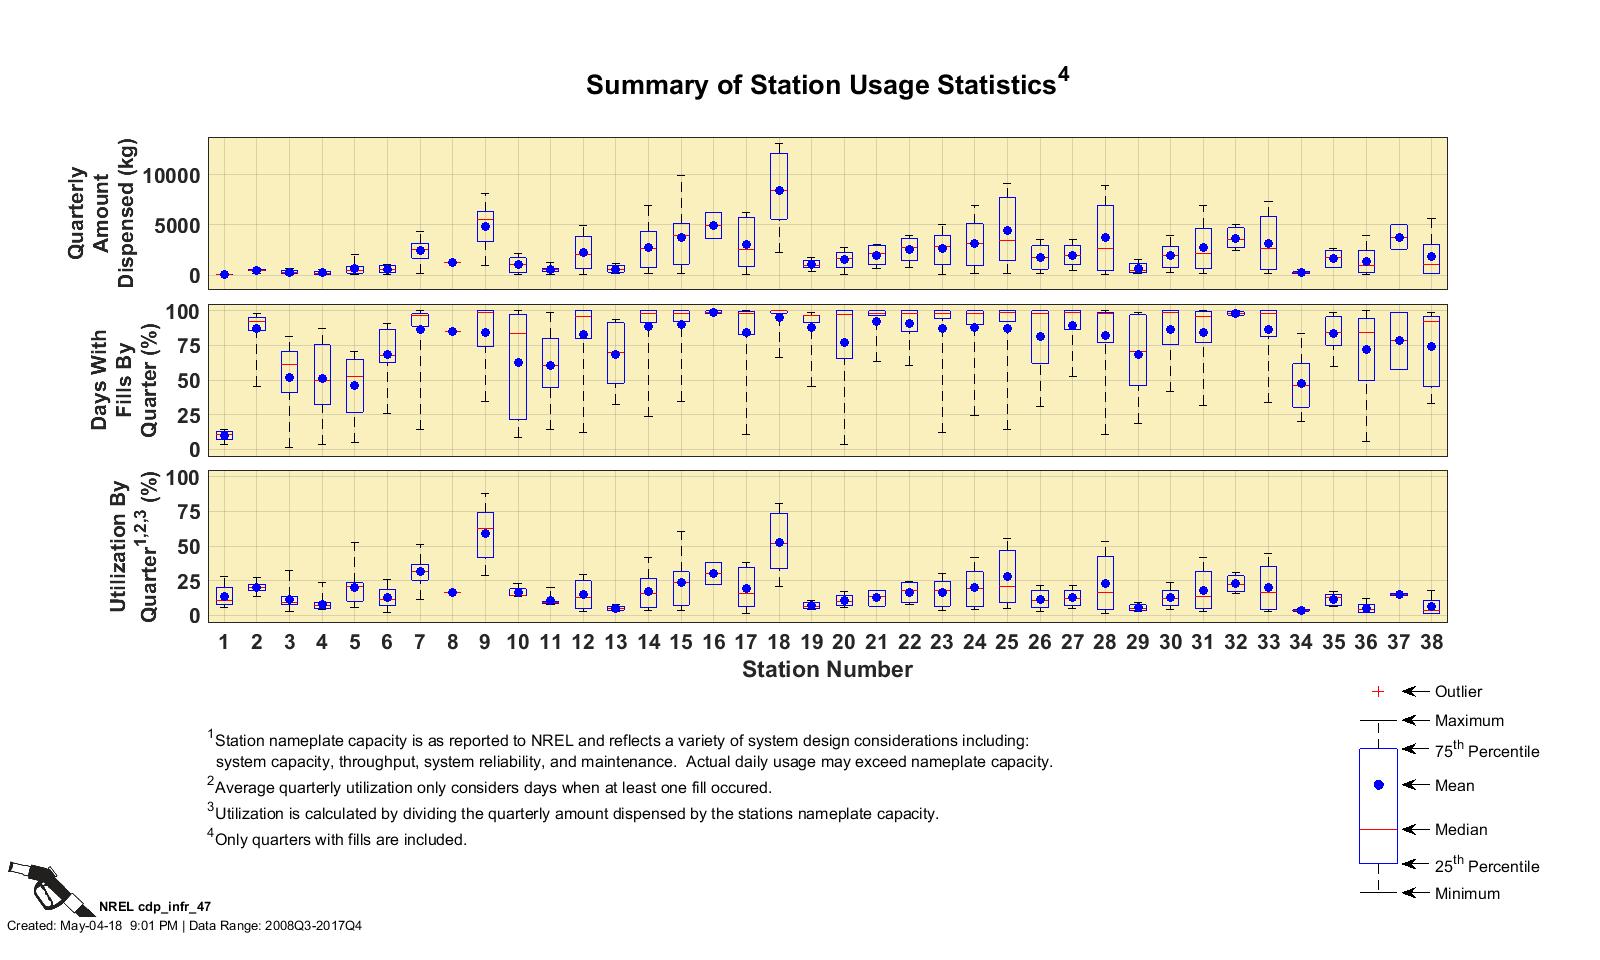
Summary of Station Usage Statistics
CDP INFR 47, 5/4/18
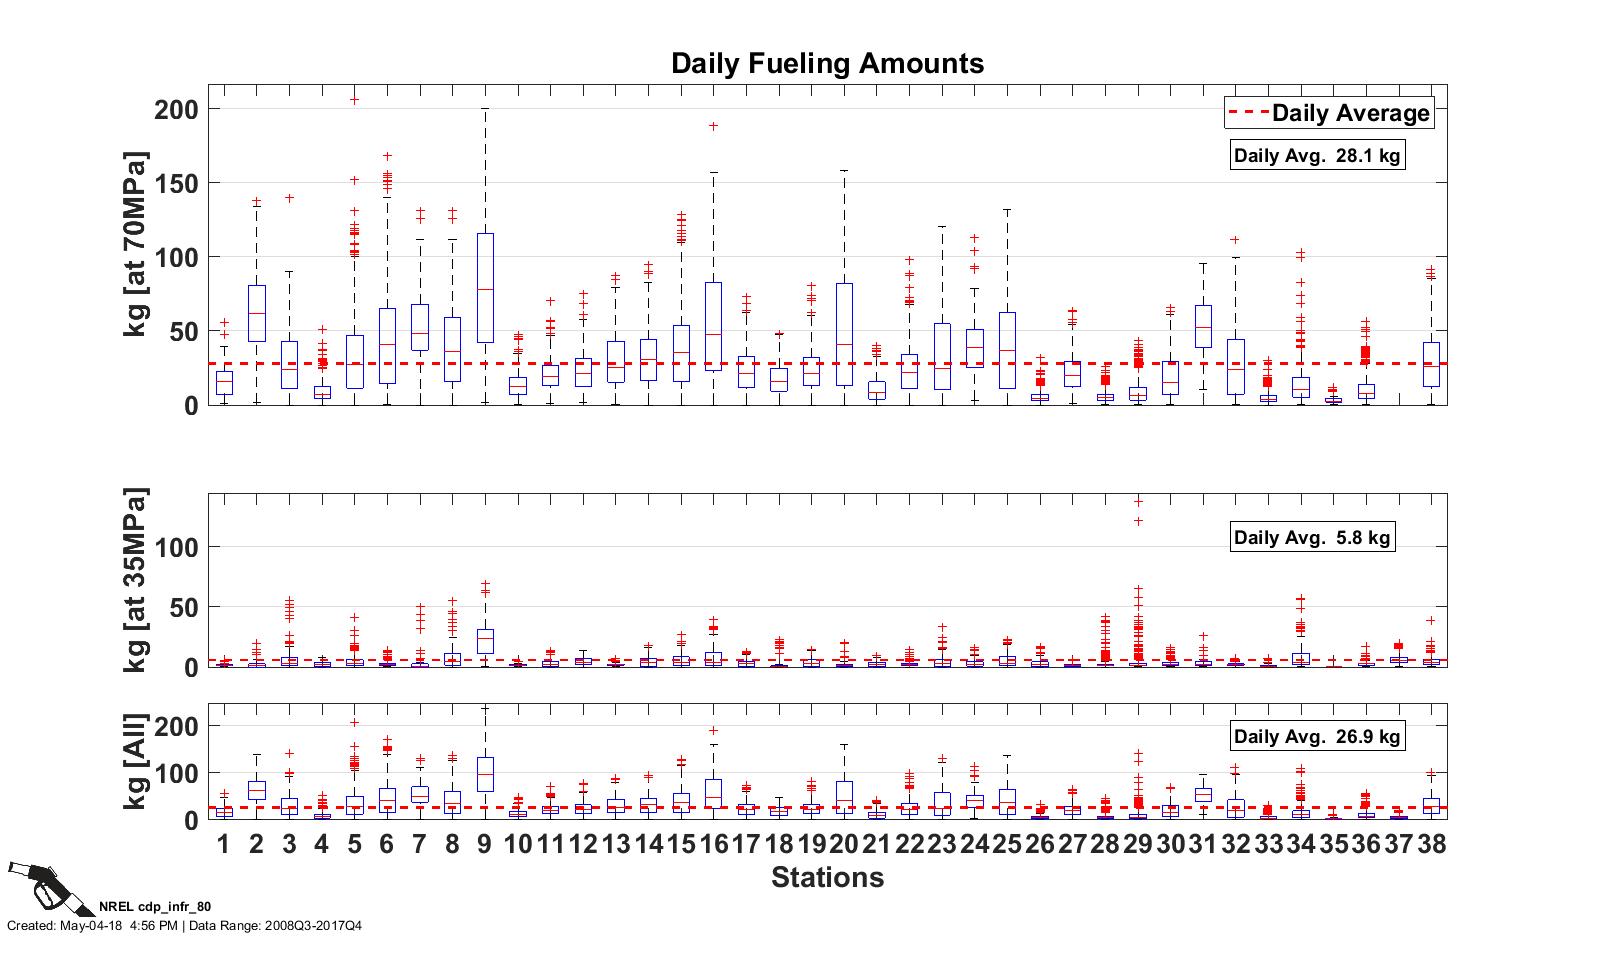
Daily Fueling Amounts by Station
CDP INFR 80, 5/4/18
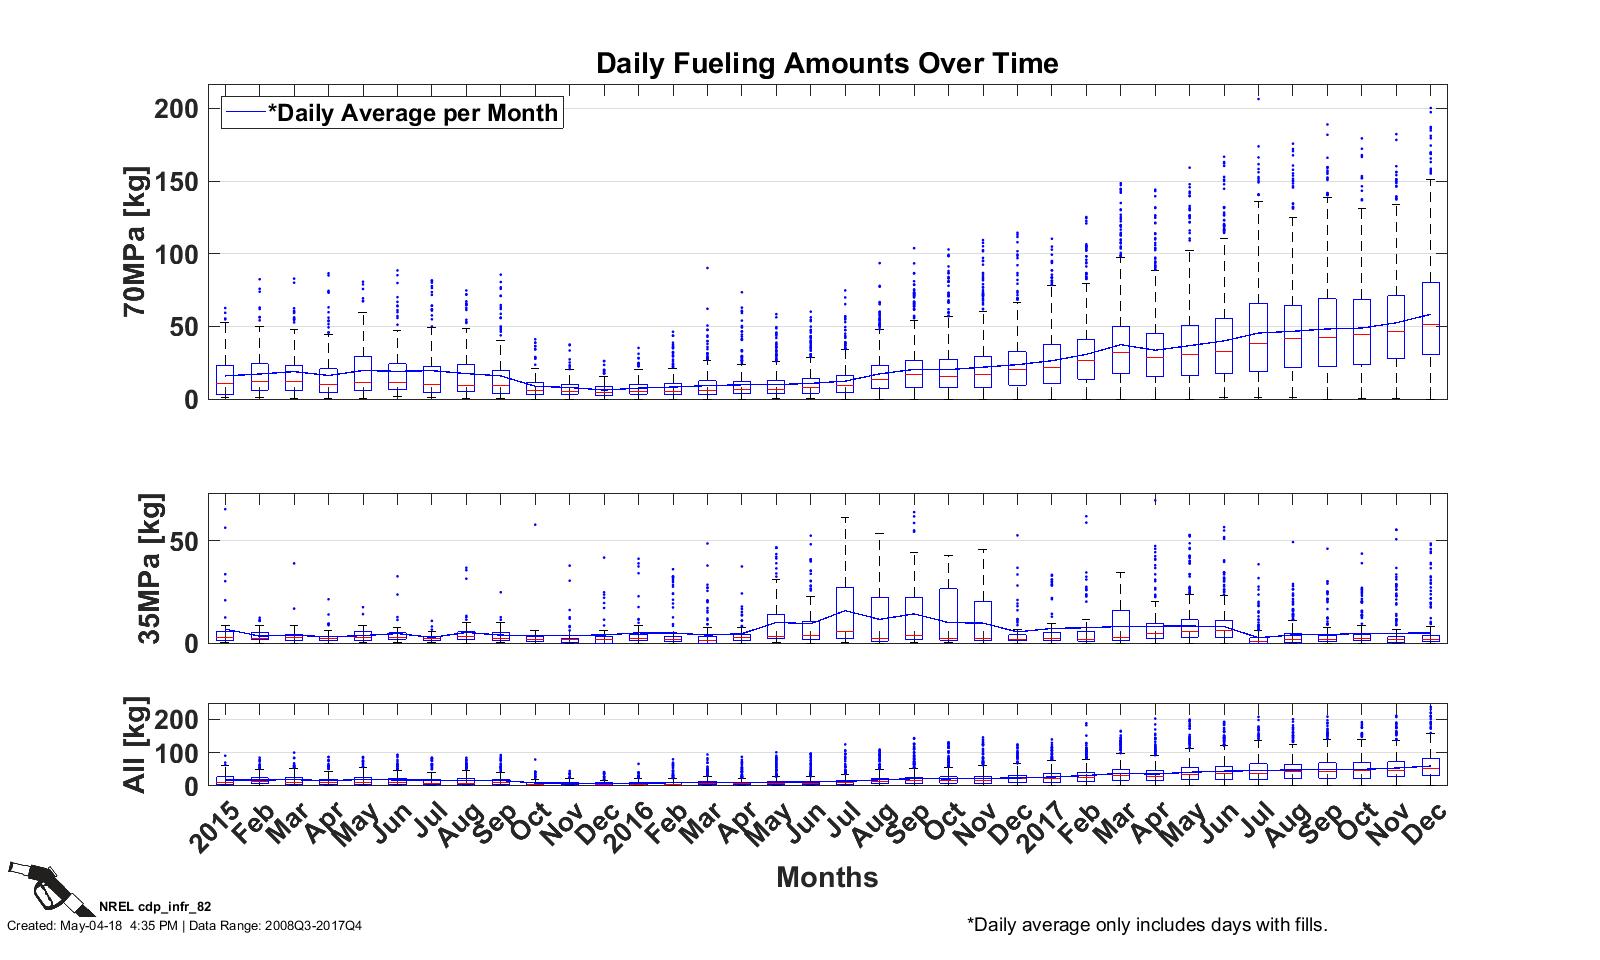
Daily Fueling Amounts by Month
CDP INFR 82, 5/4/18
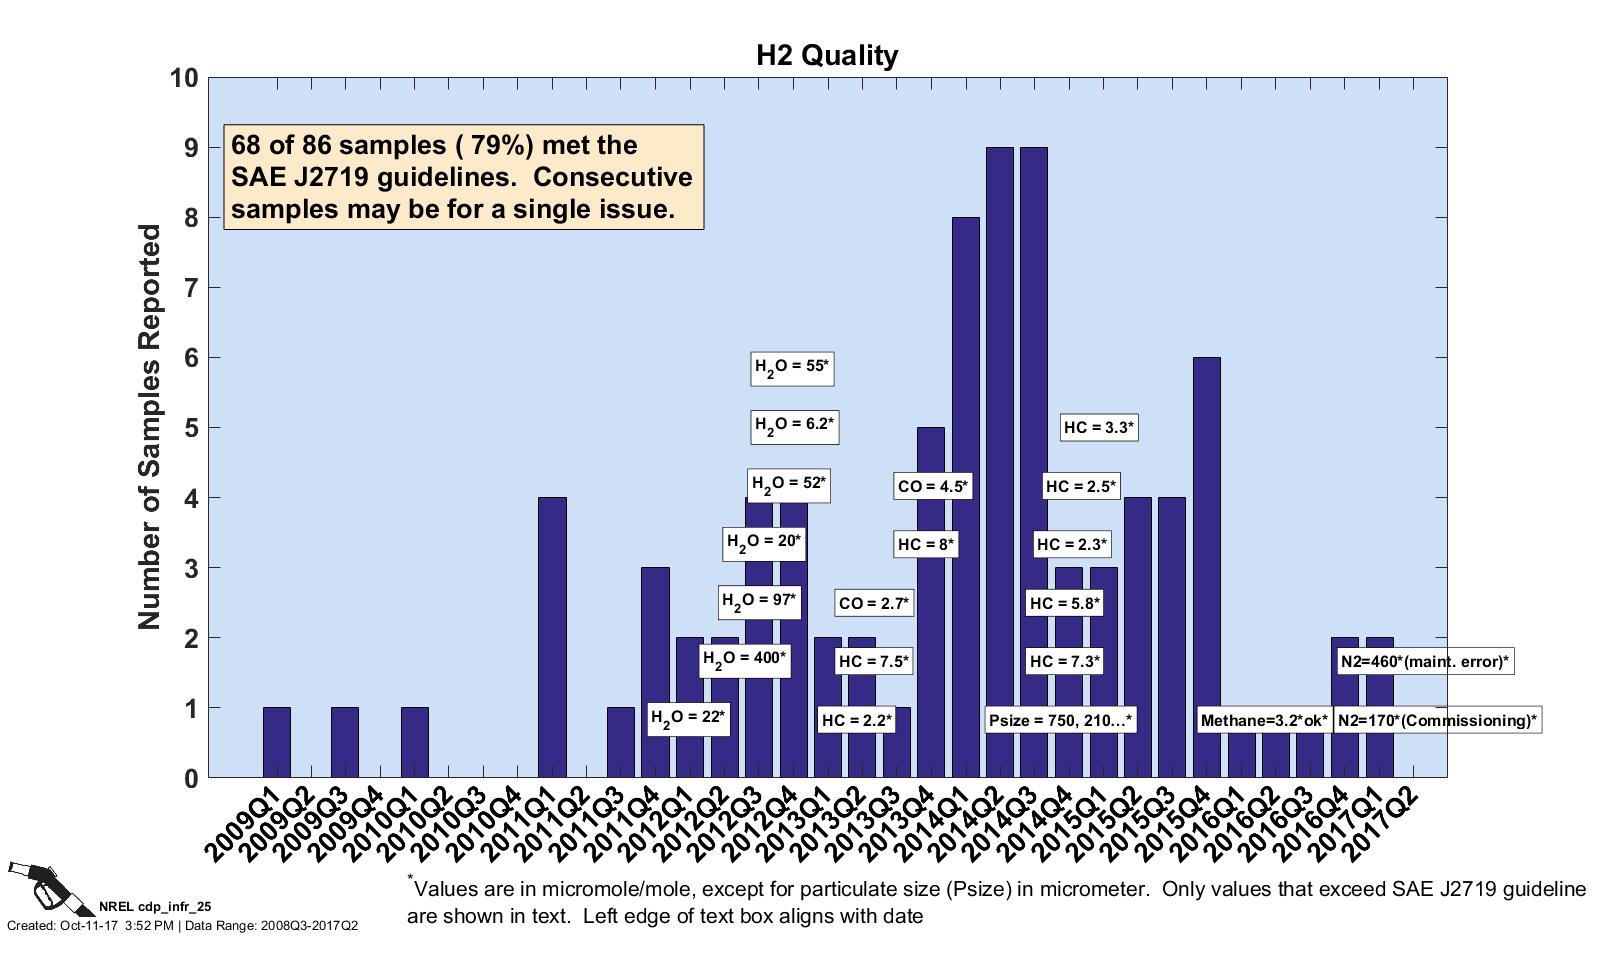
Hydrogen Quality
CDP INFR 25, 10/11/17
Impurities—Ammonia
CDP INFR 79, 10/11/17
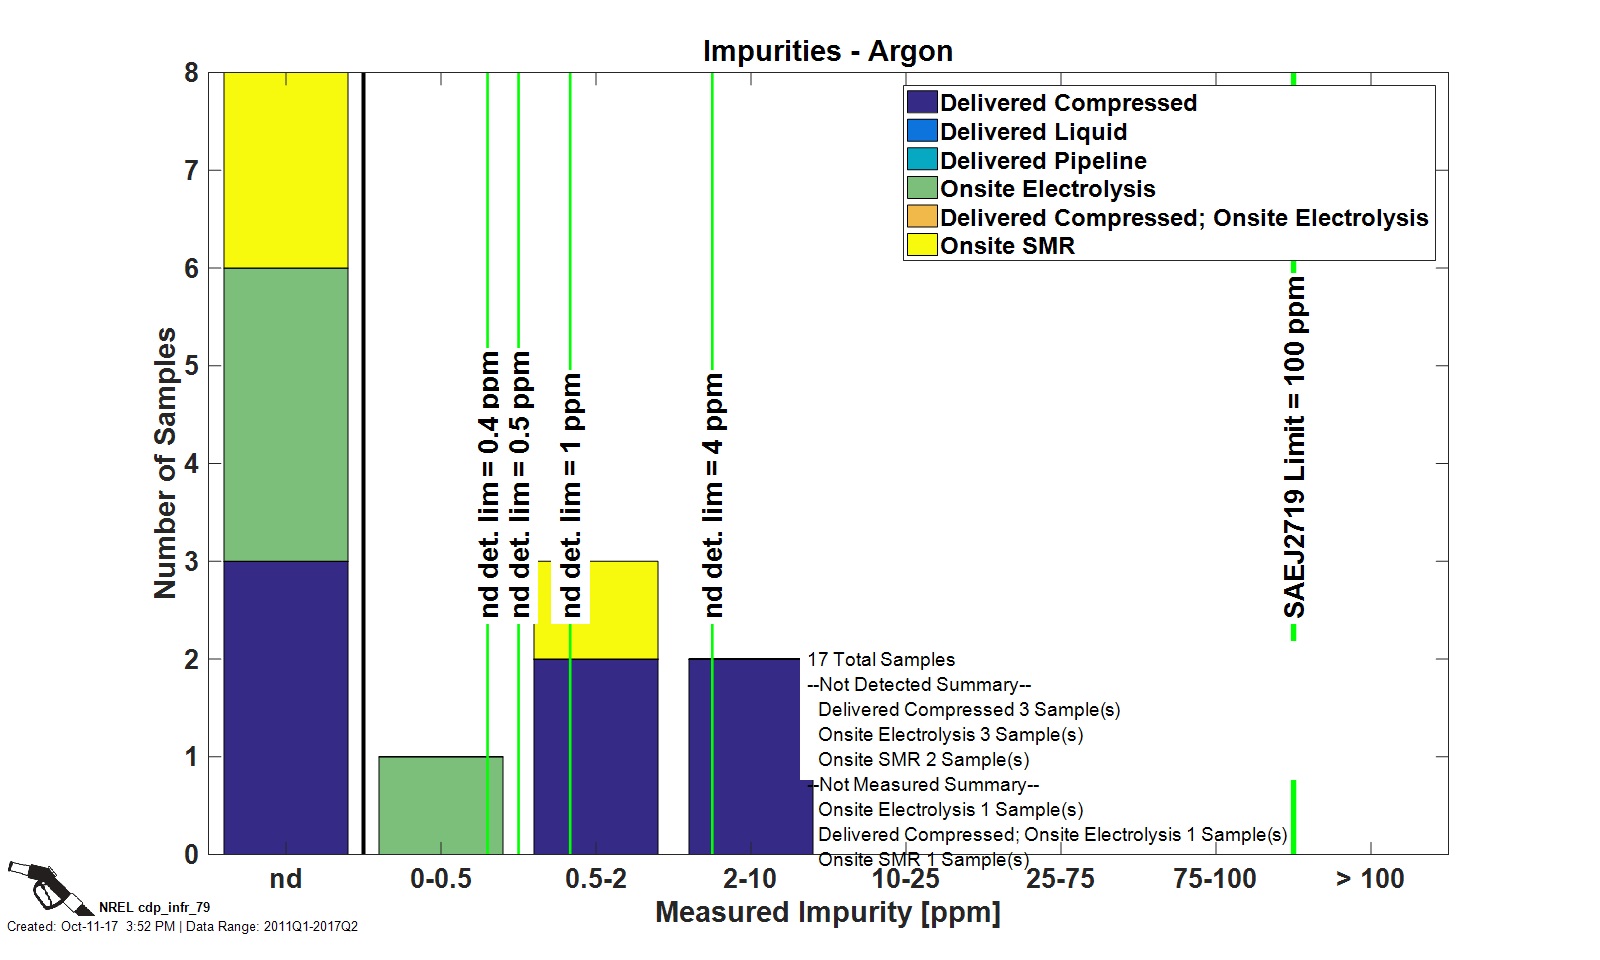
Impurities—Argon
CDP INFR 79, 10/11/17
Impurities—Carbon Dioxide
CDP INFR 79, 10/11/17
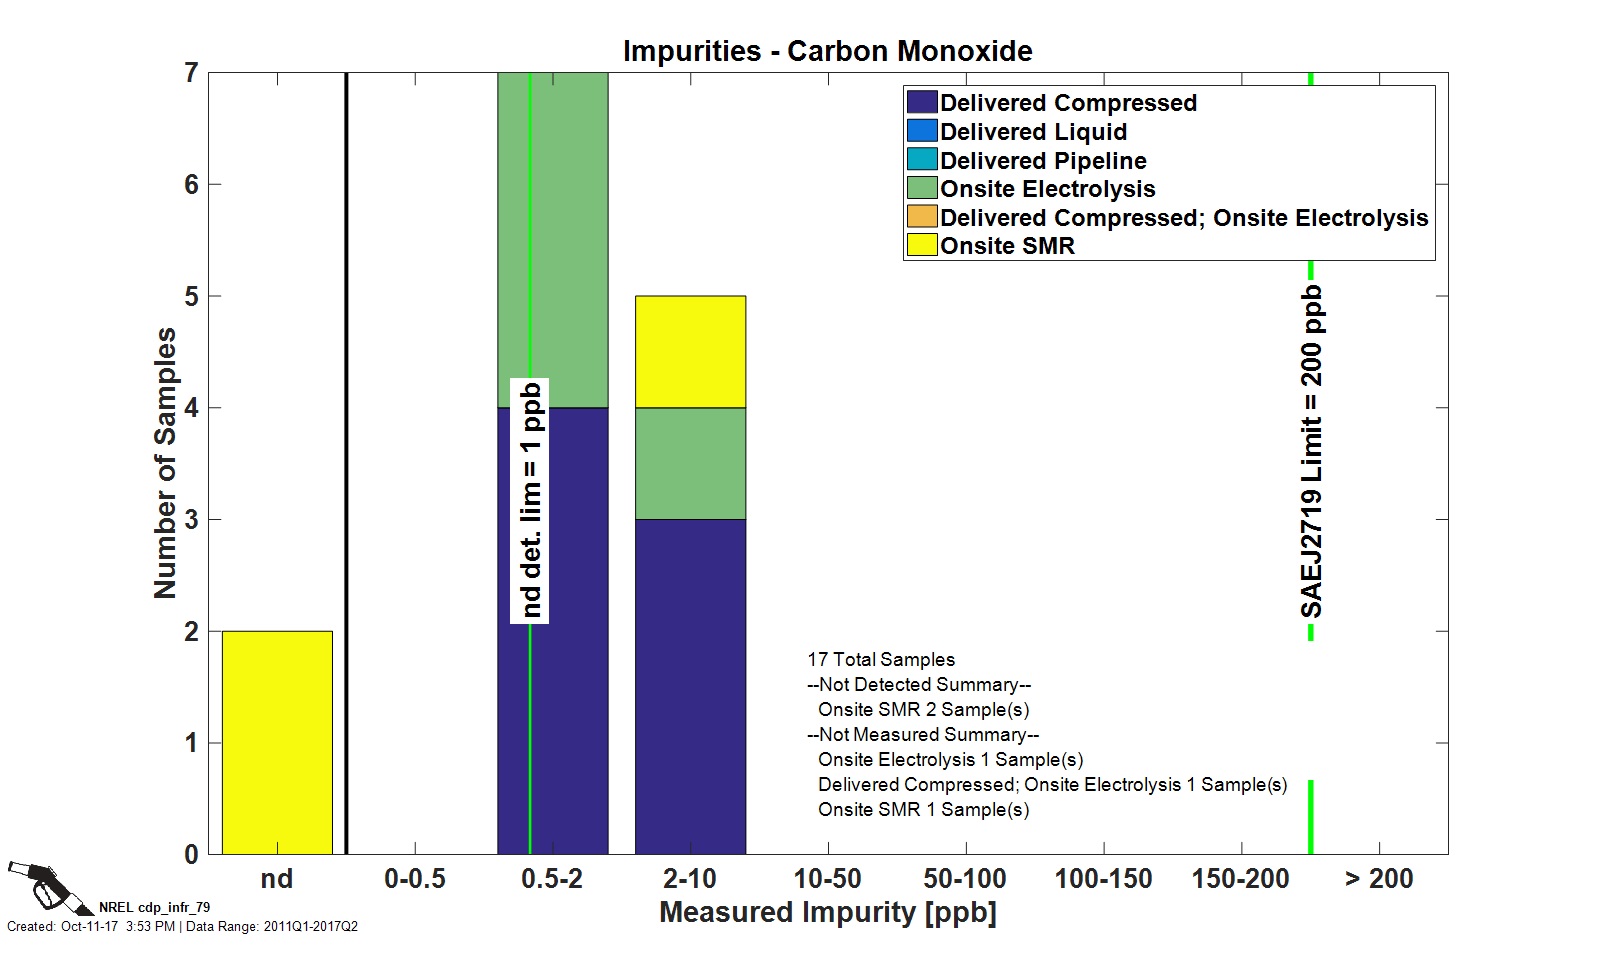
Impurities—Carbon Monoxide
CDP INFR 79, 10/11/17
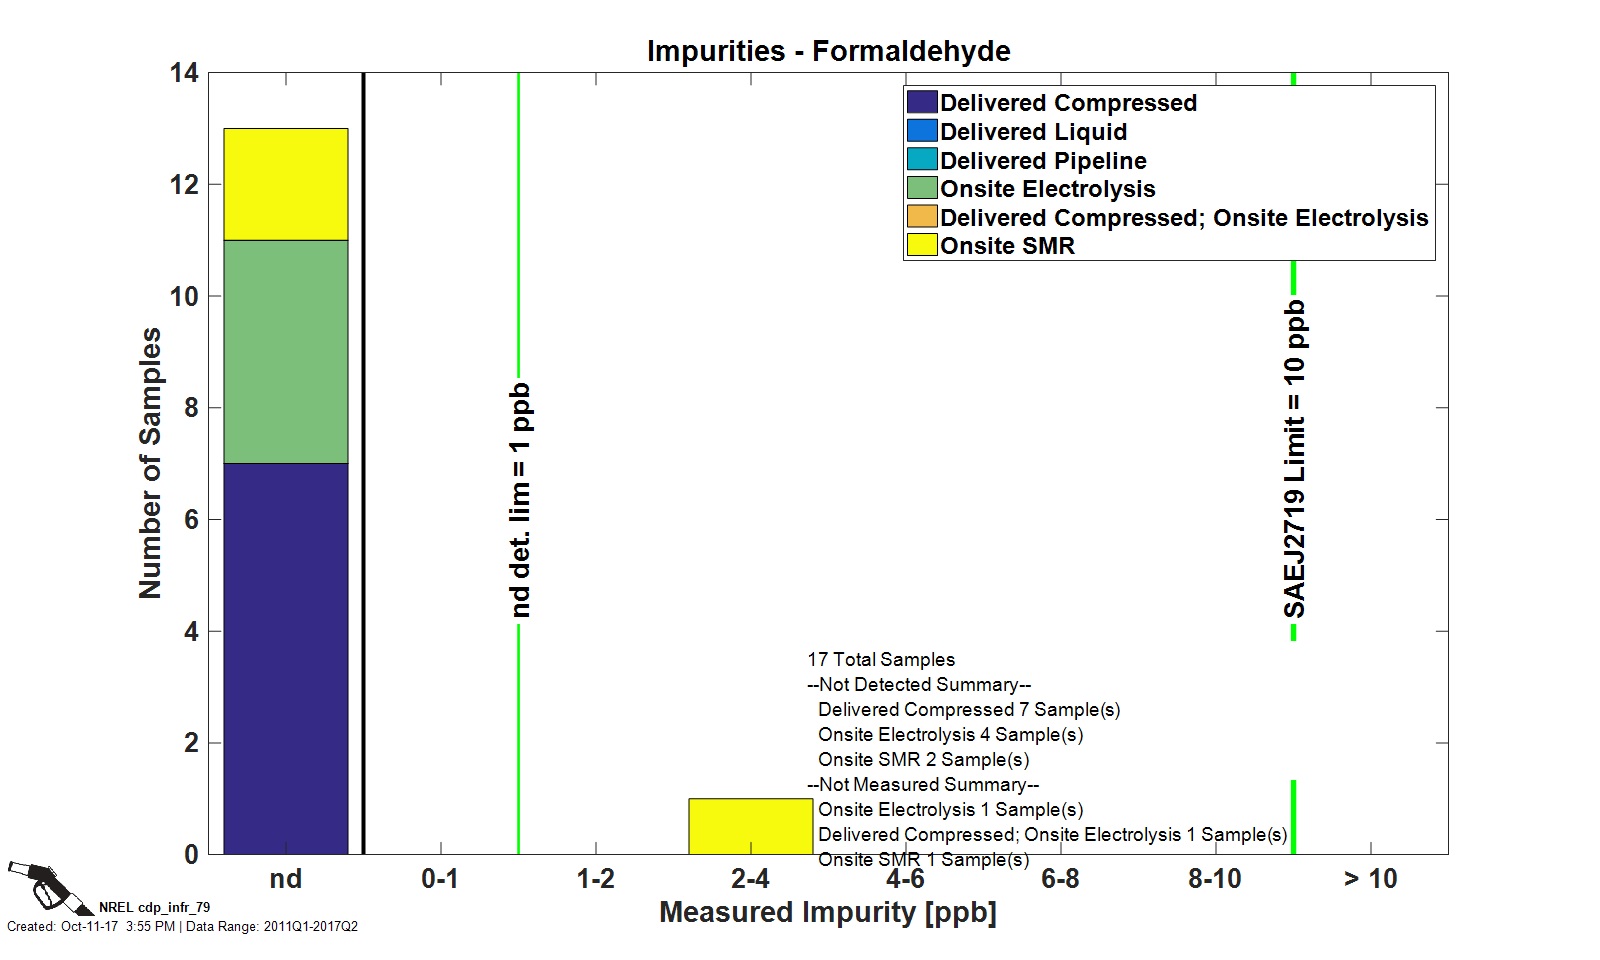
Impurities—Formaldehyde
CDP INFR 79, 10/11/17
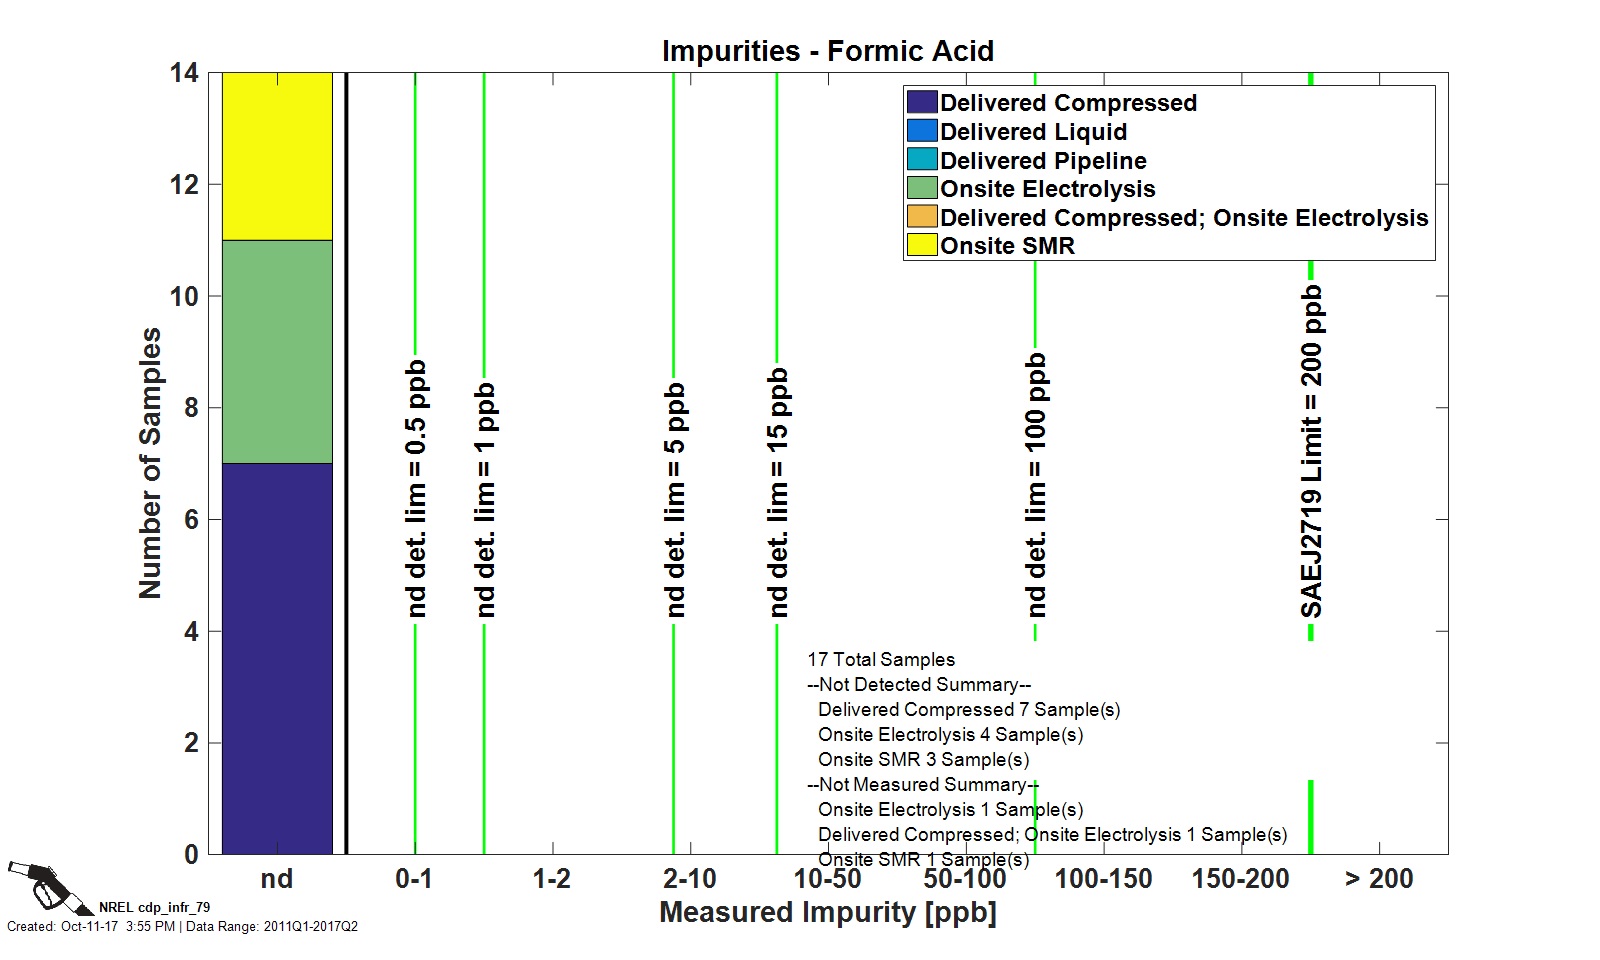
Impurities—Formic Acid
CDP INFR 79, 10/11/17
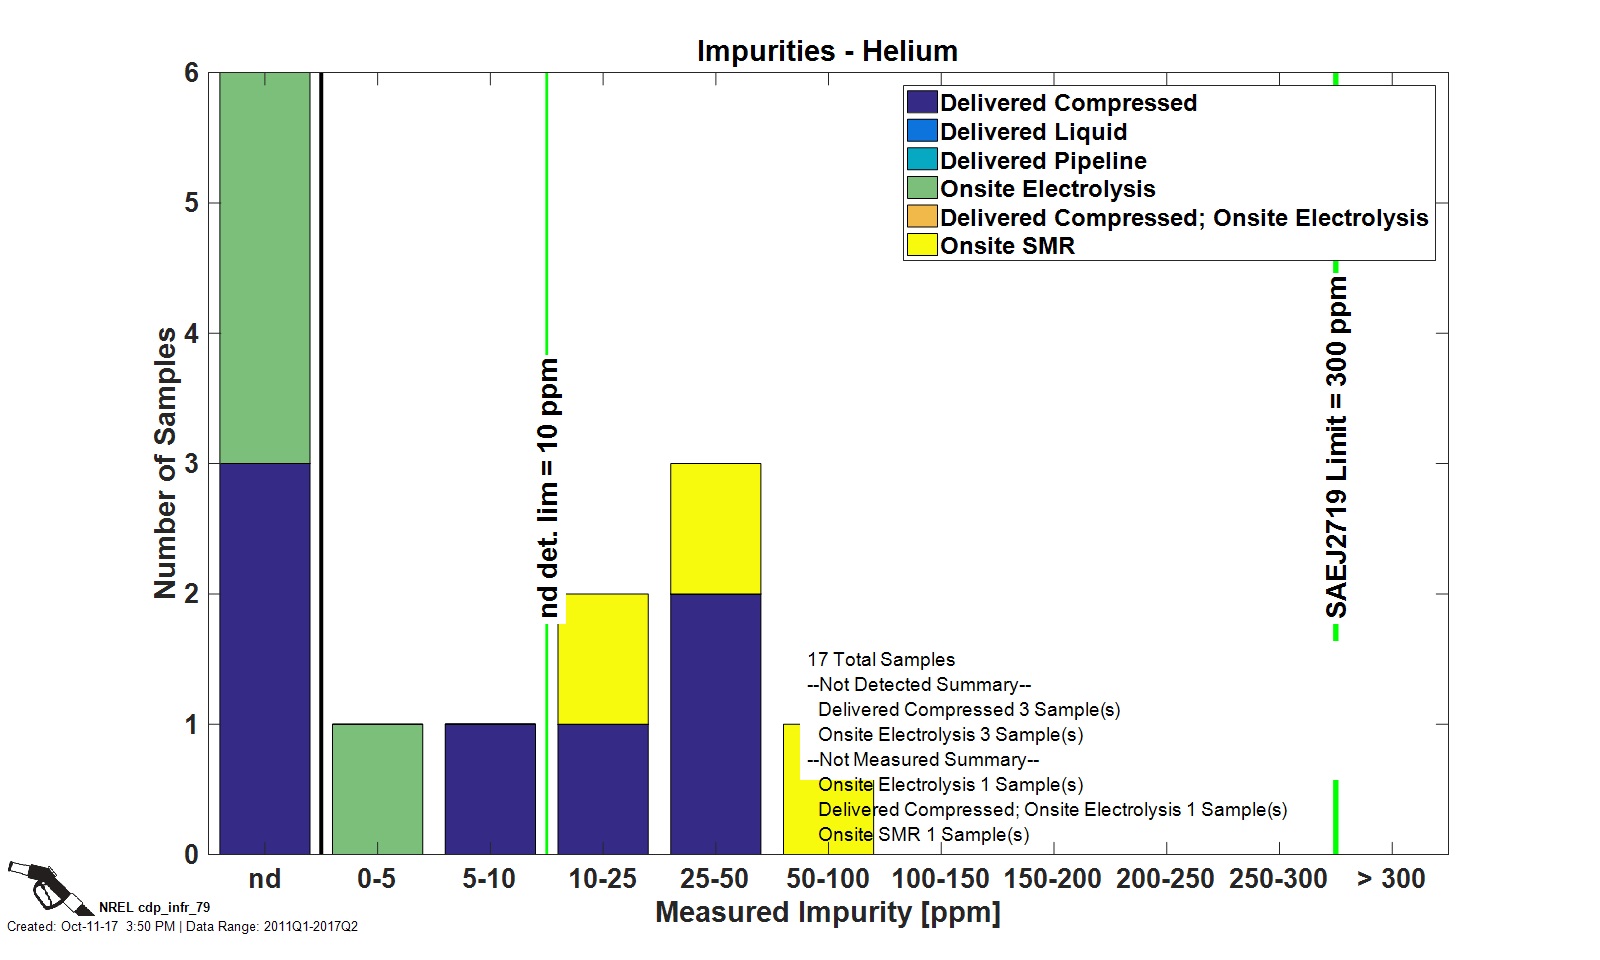
Impurities—Helium
CDP INFR 79, 10/11/17
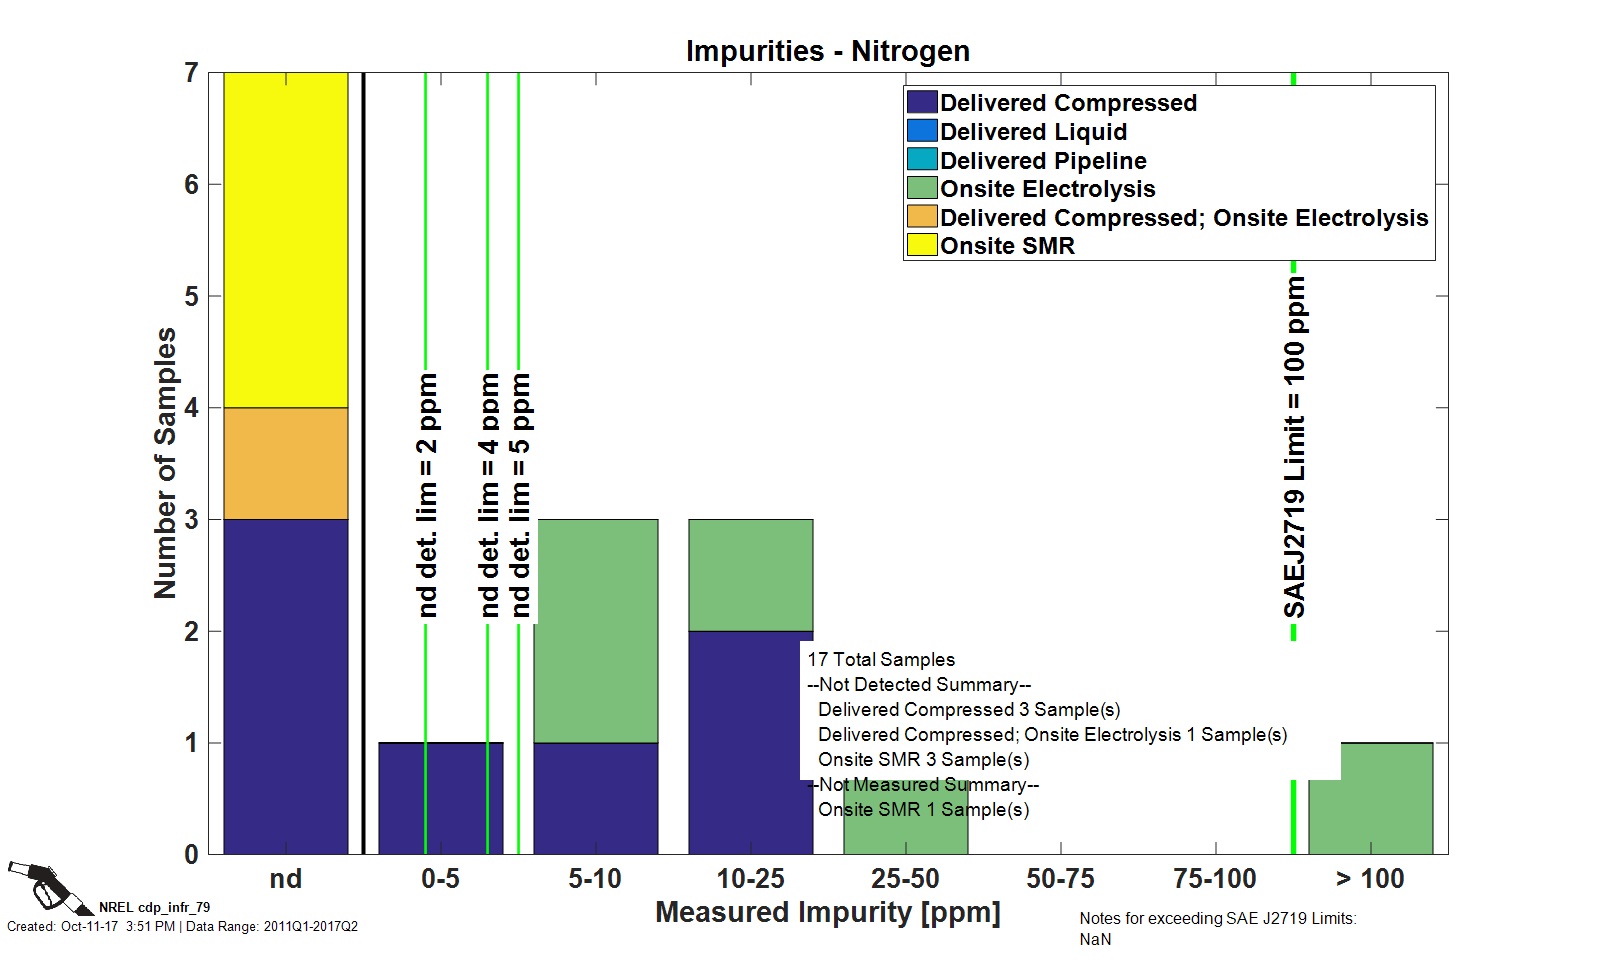
Impurities—Nitrogen
CDP INFR 79, 10/11/17
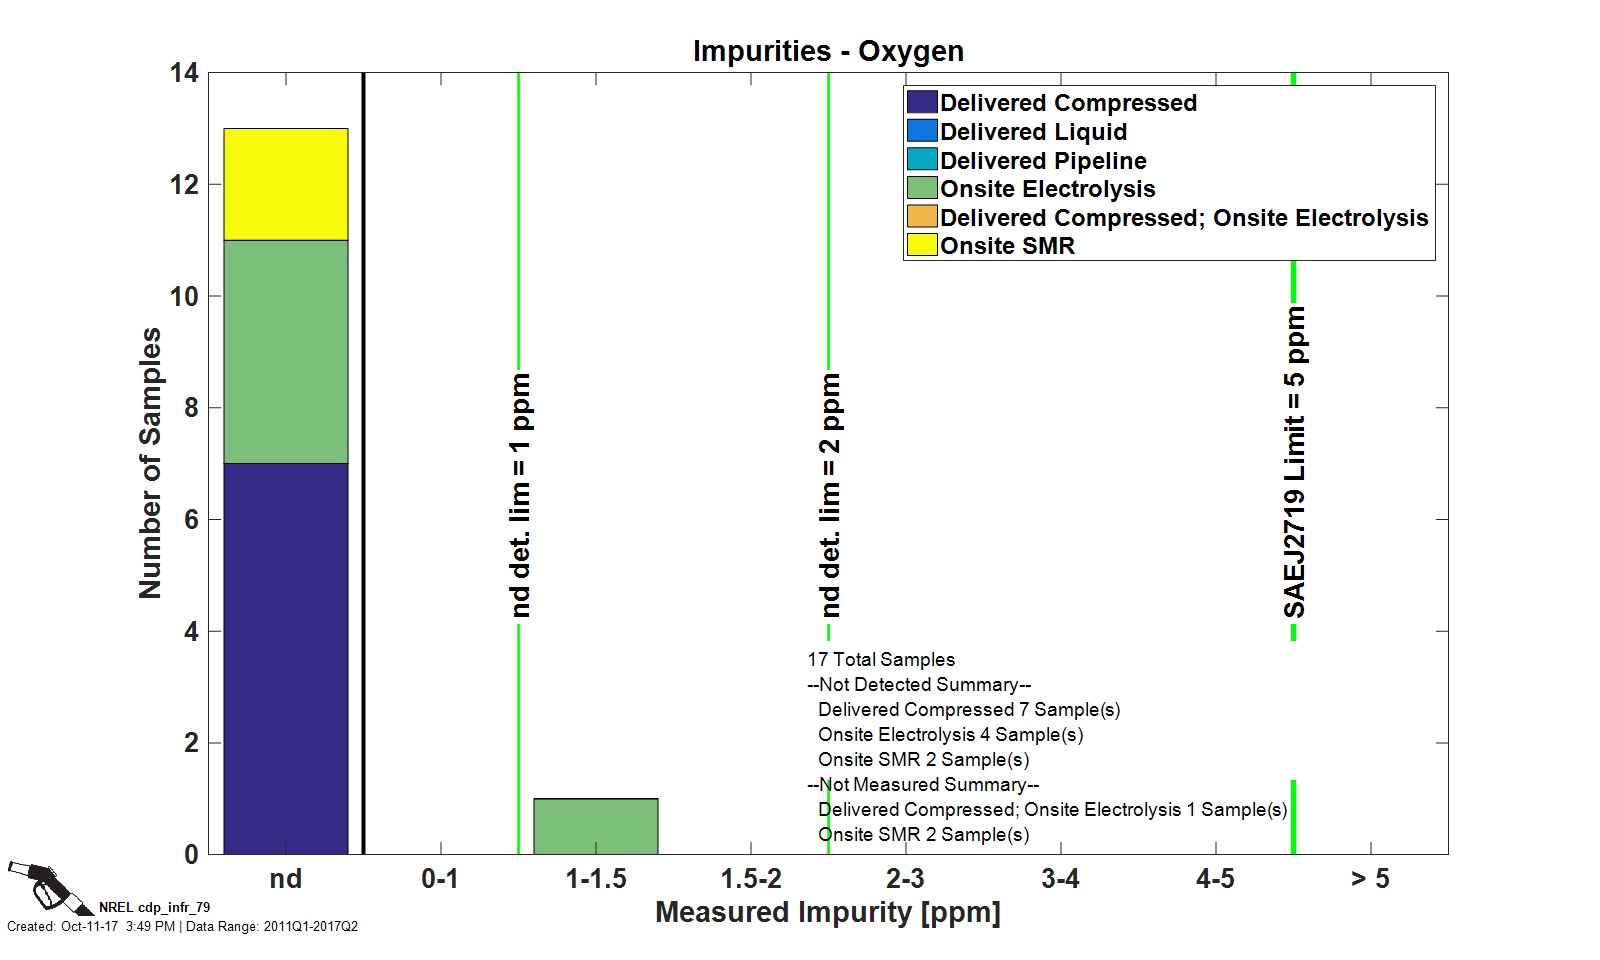
Impurities—Oxygen
CDP INFR 79, 10/11/17
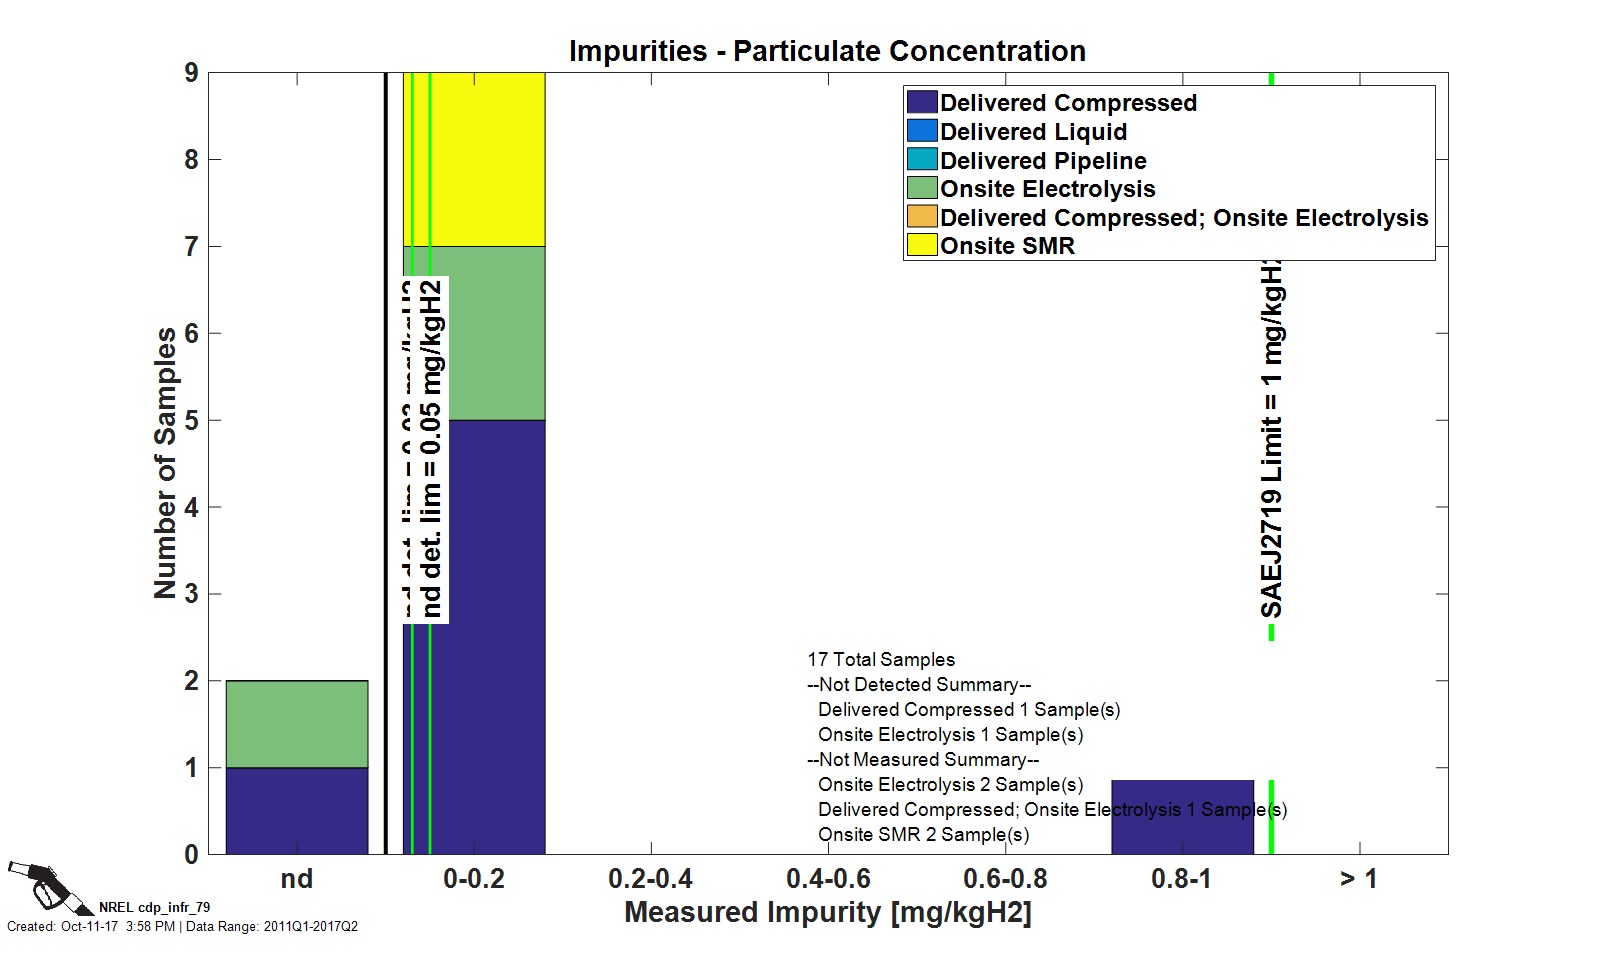
Impurities—Particulate Concentration
CDP INFR 79, 10/11/17
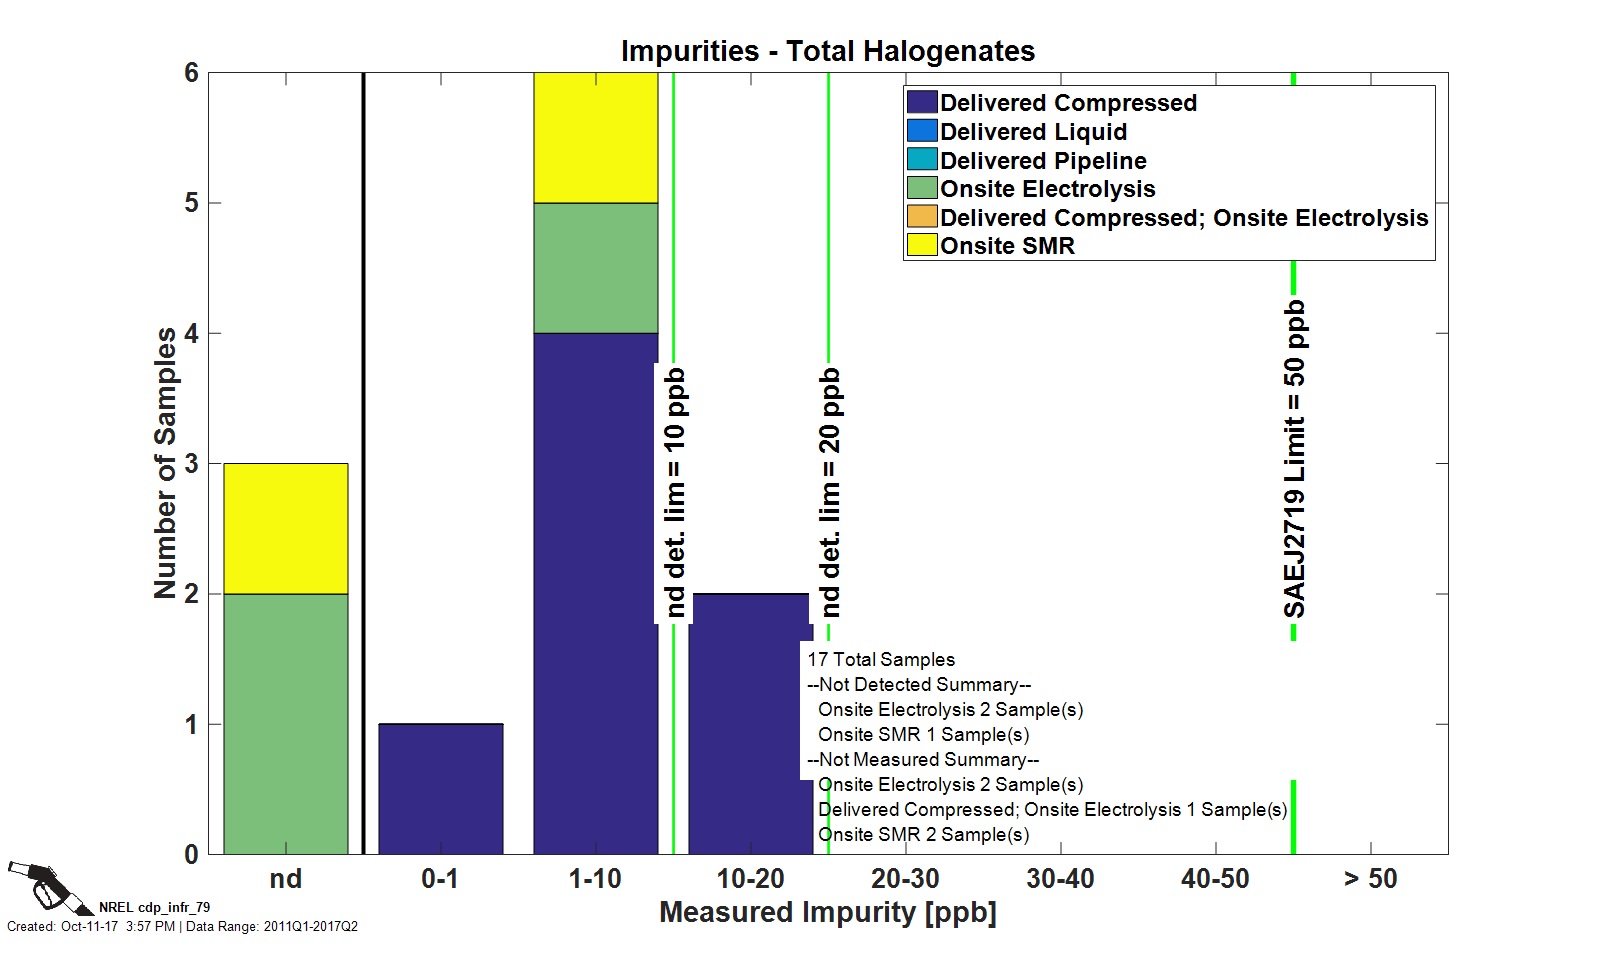
Impurities—Total Halogenates
CDP INFR 79, 10/11/17
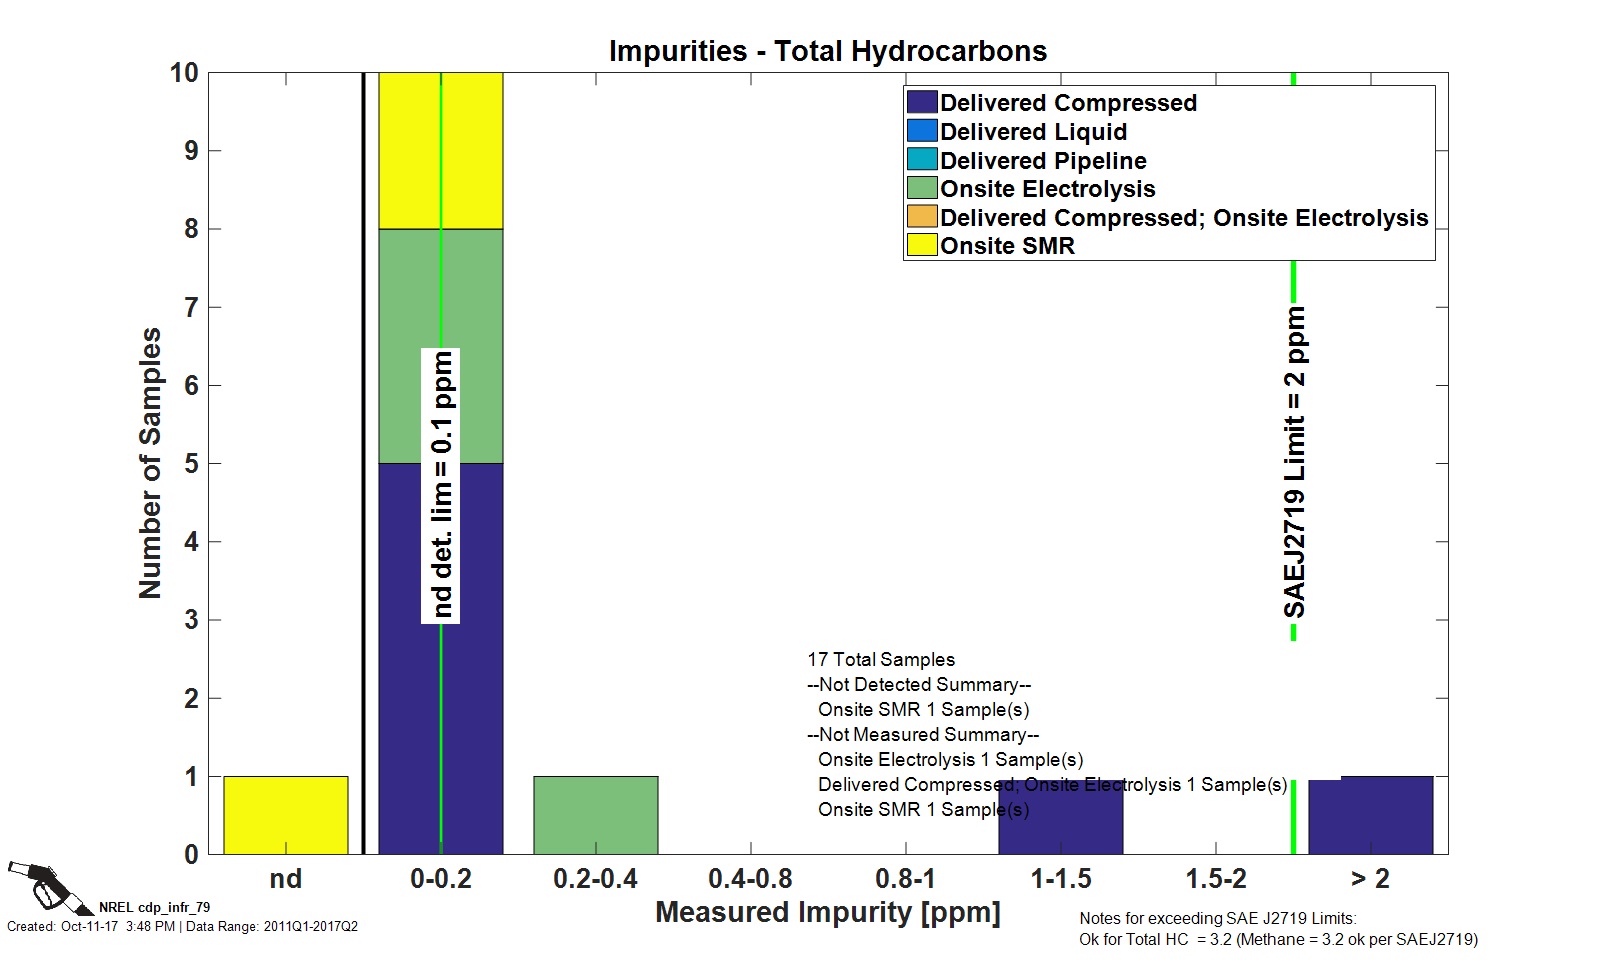
Impurities—Total Hydrocarbons
CDP INFR 79, 10/11/17
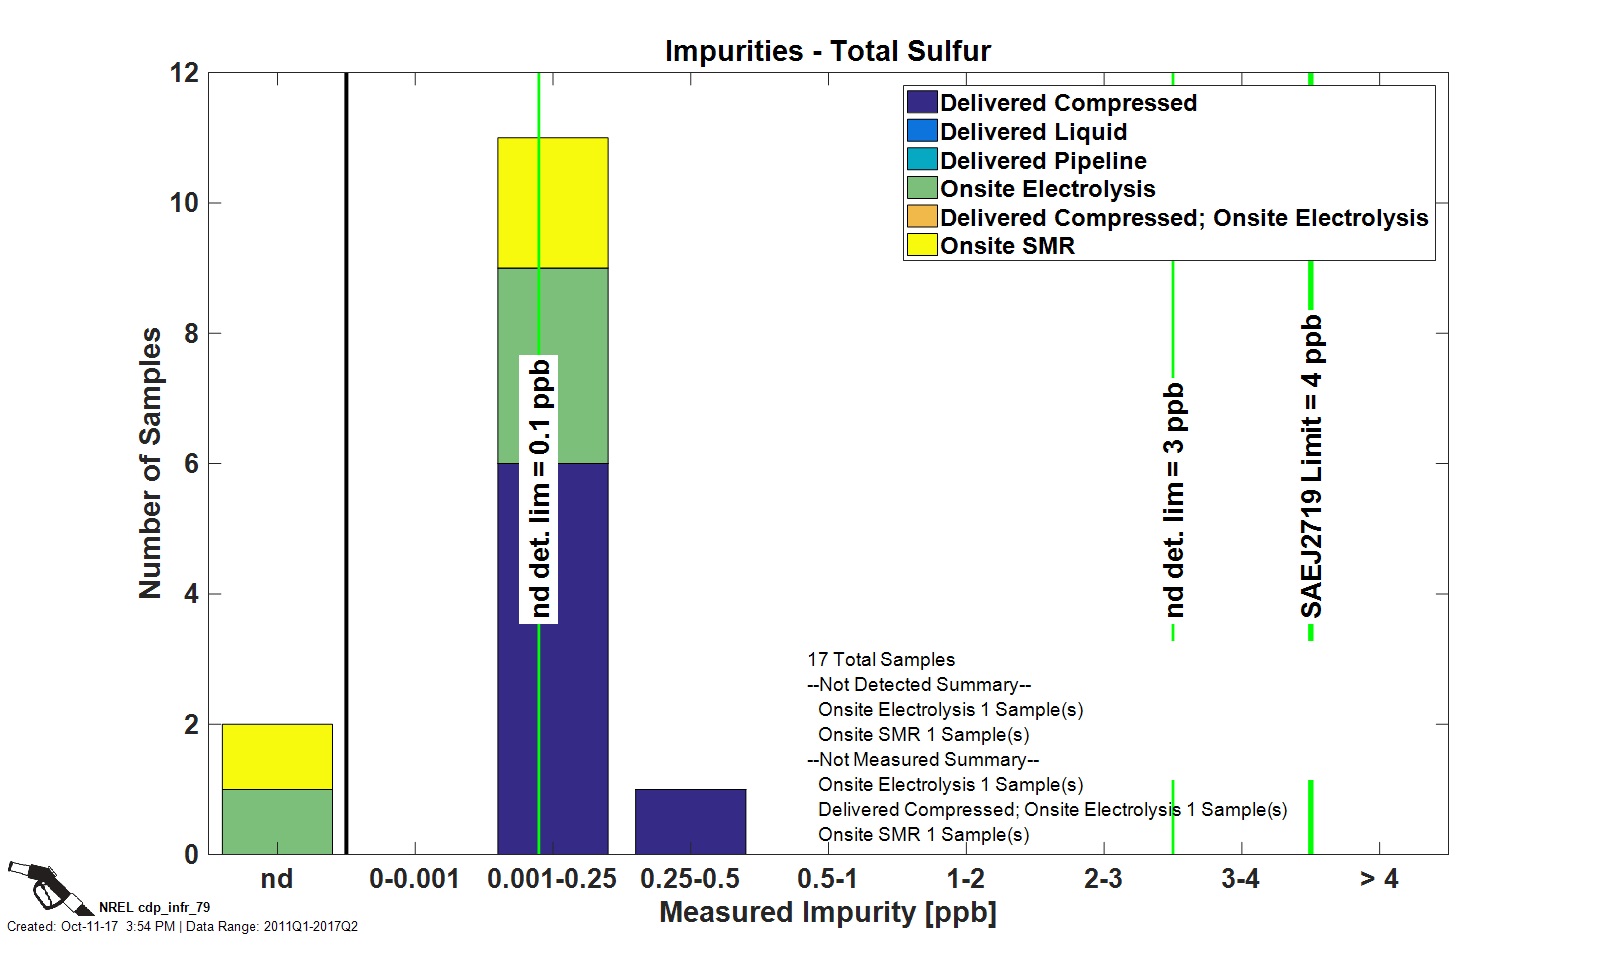
Impurities—Total Sulfur
CDP INFR 79, 10/11/17
Impurities—Water
CDP INFR 79, 10/11/17
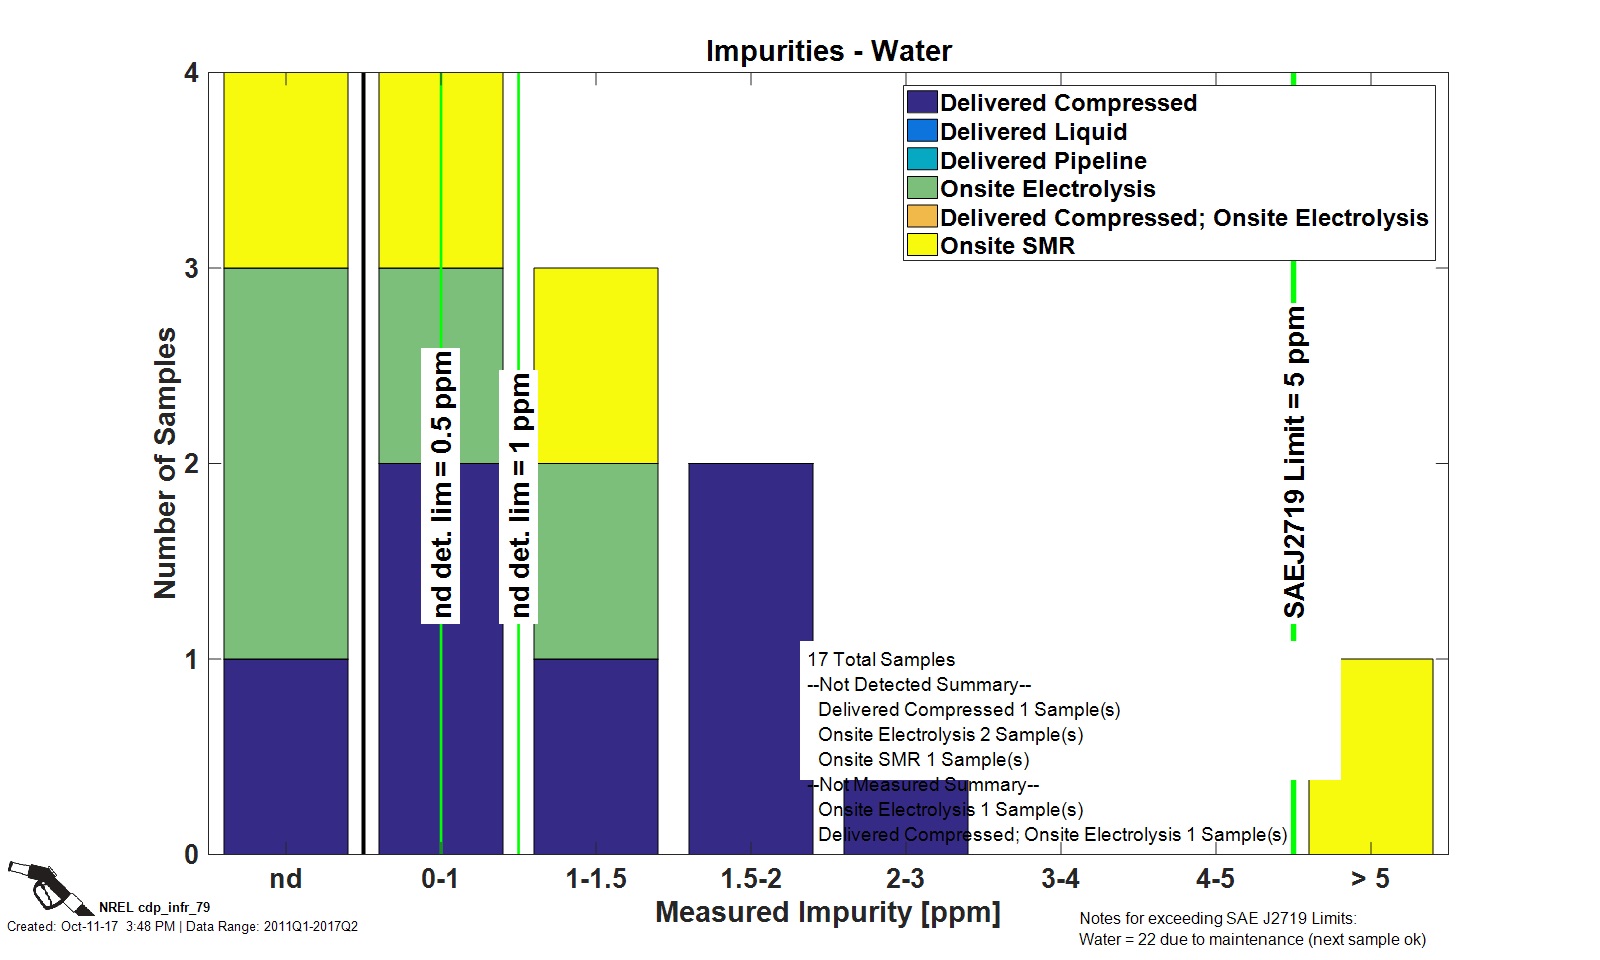
Compressor Energy
CDP INFR 35, 5/7/18
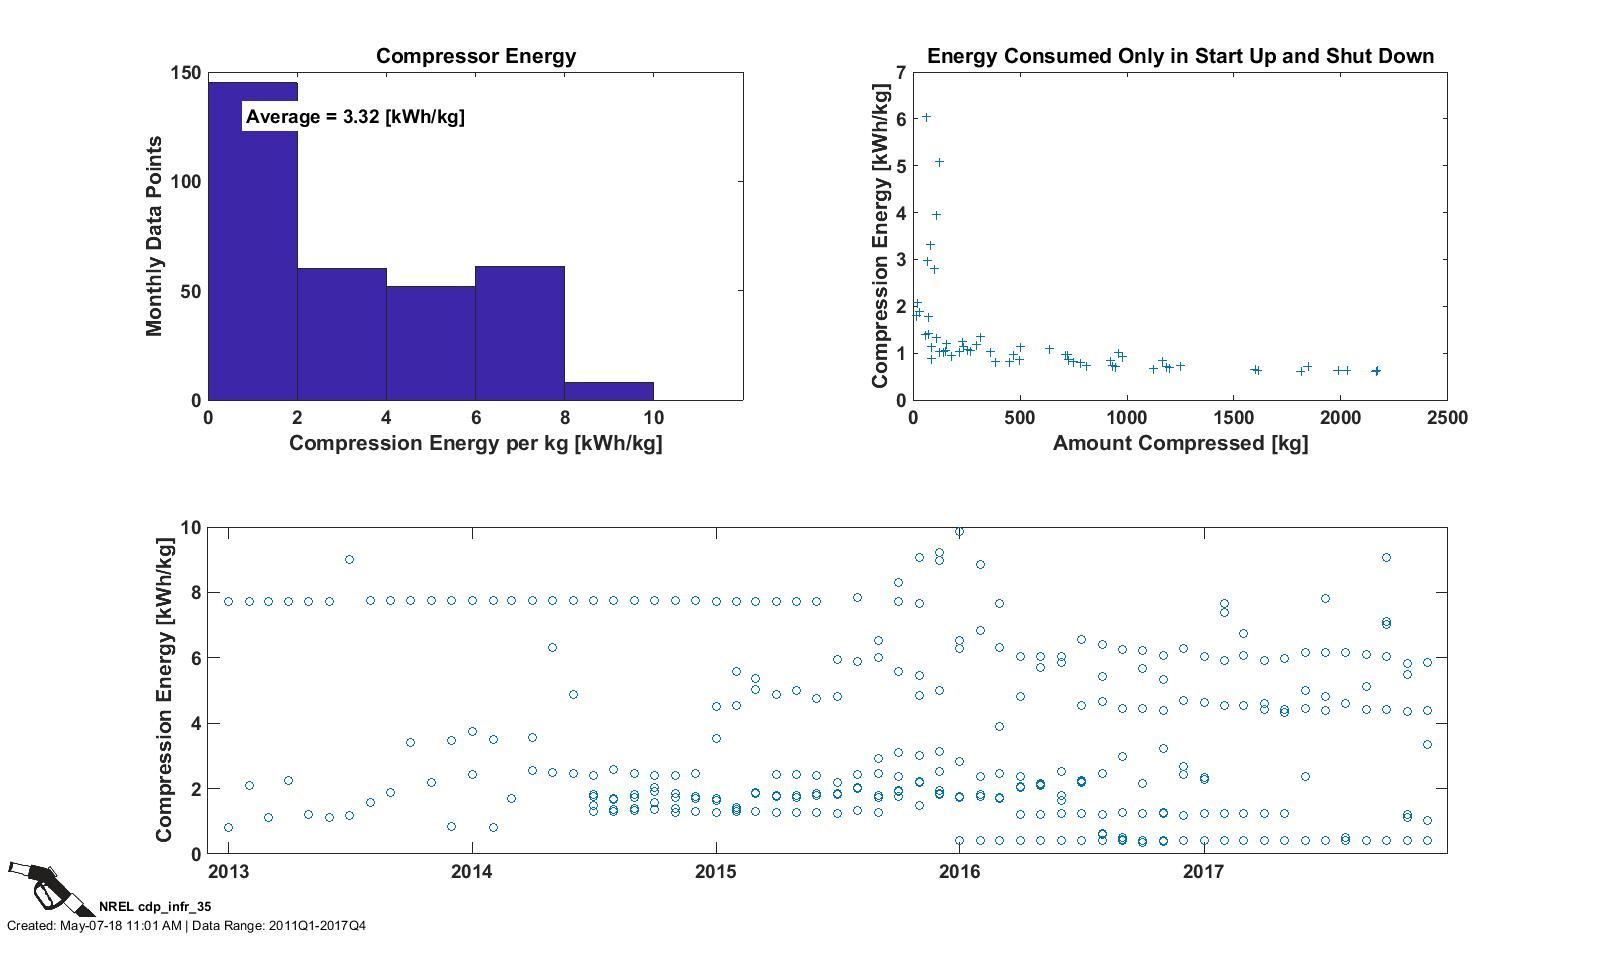
Electrolyzer Energy
CDP INFR 36, 5/16/18
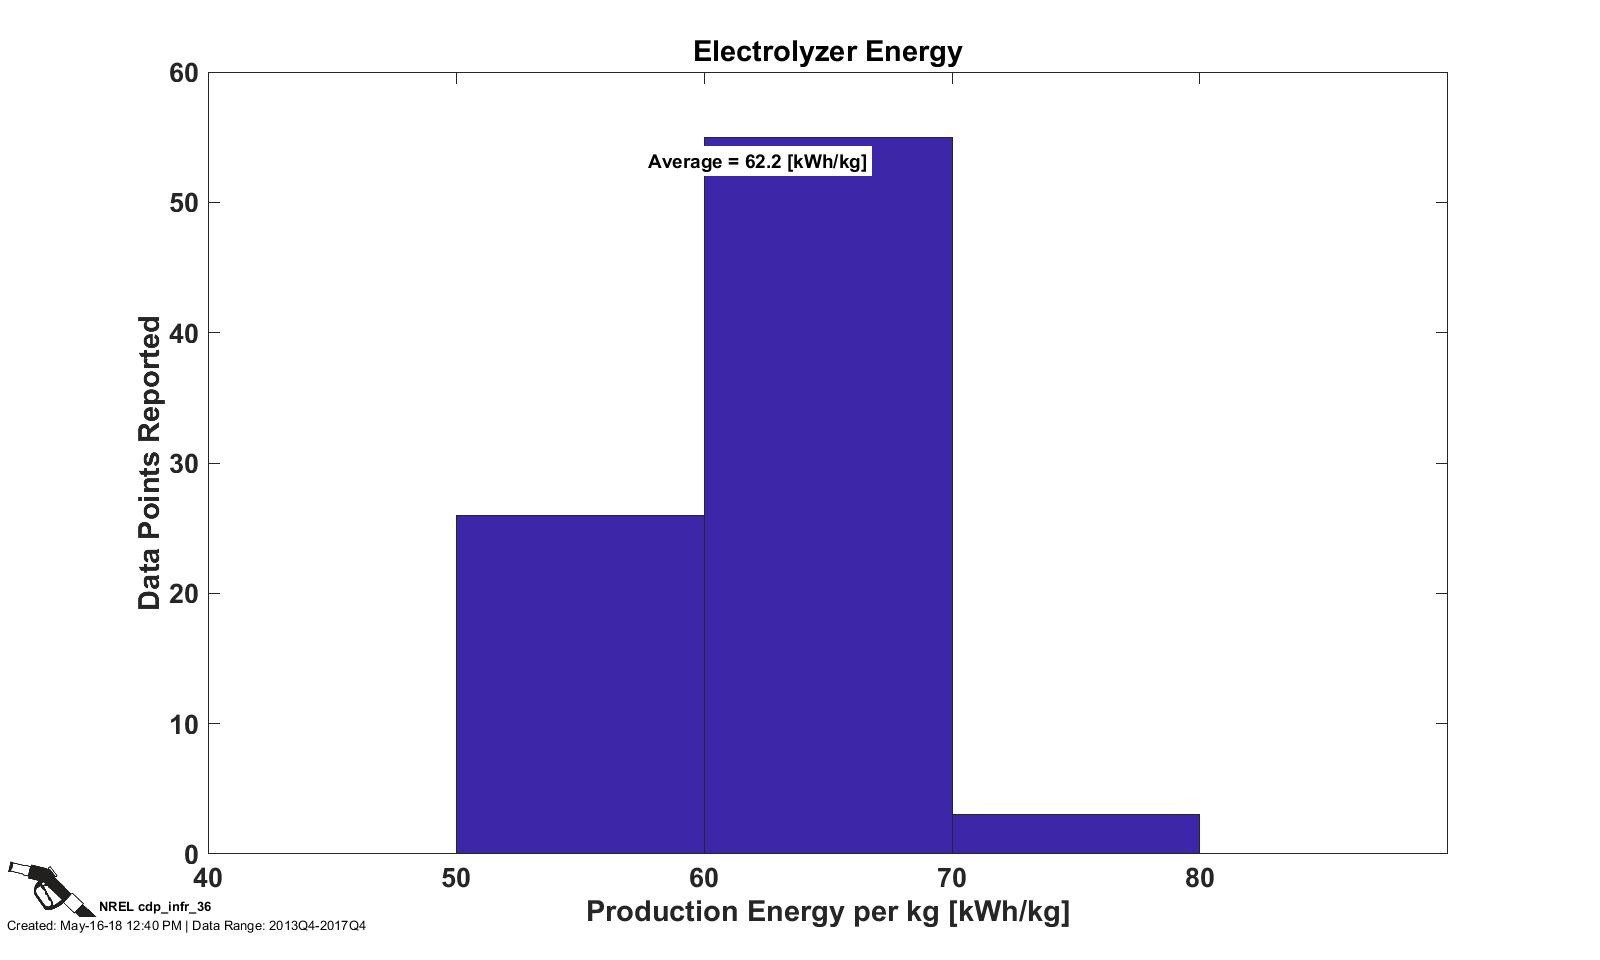
Station Energy per kg Dispensed
CDP INFR 78, 5/15/18
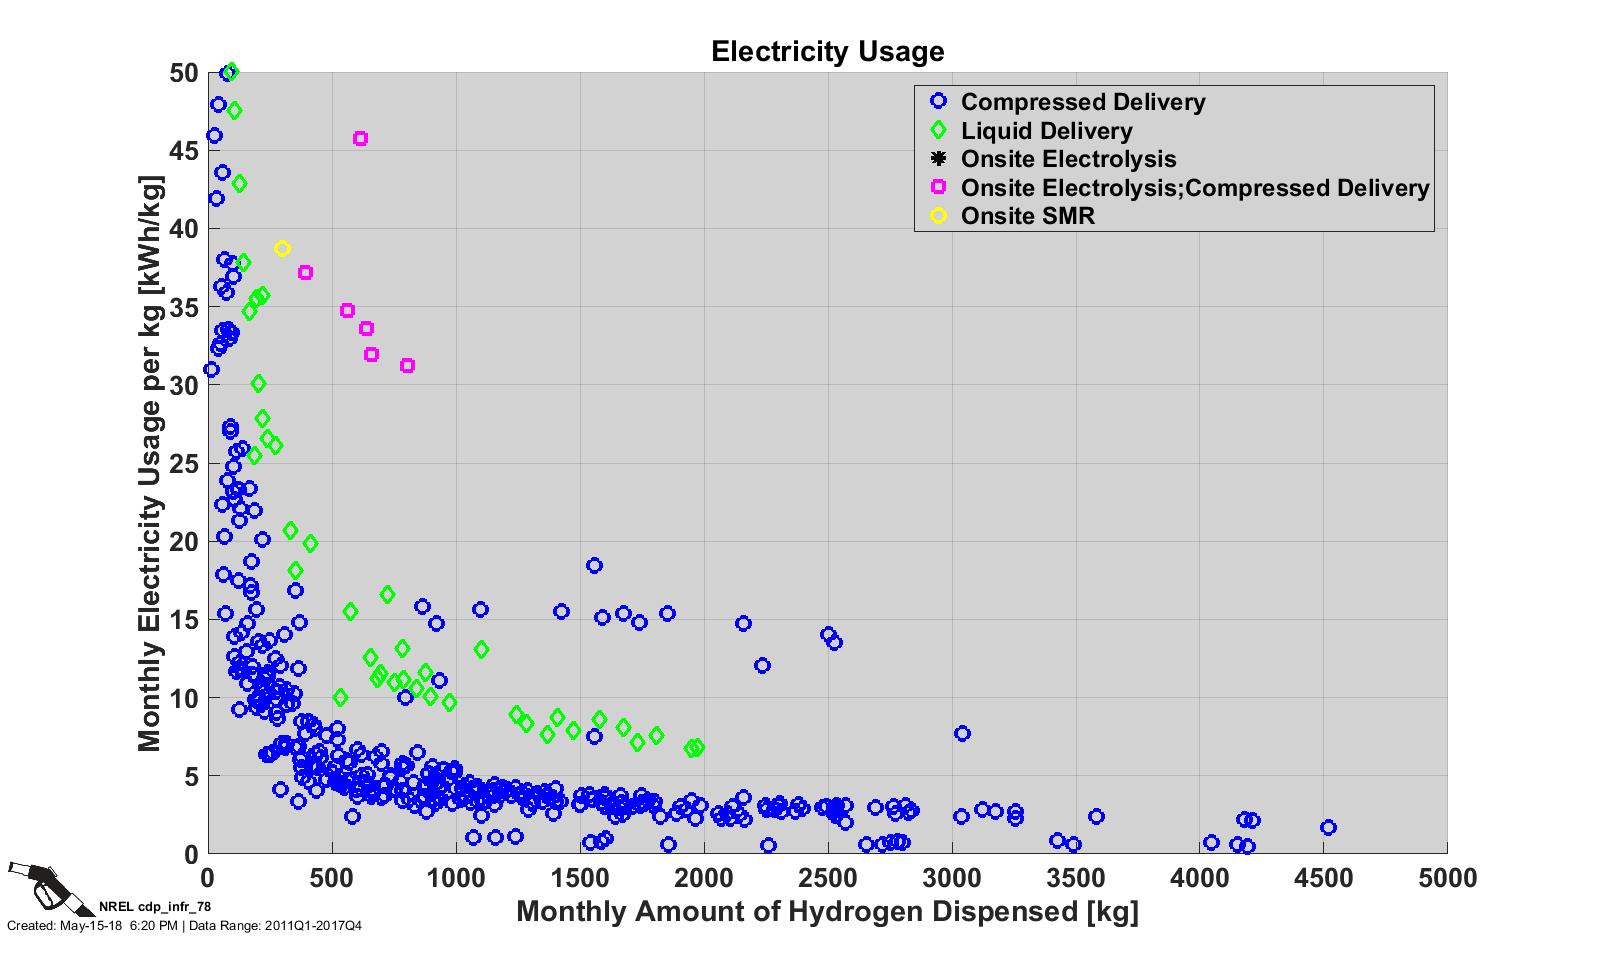
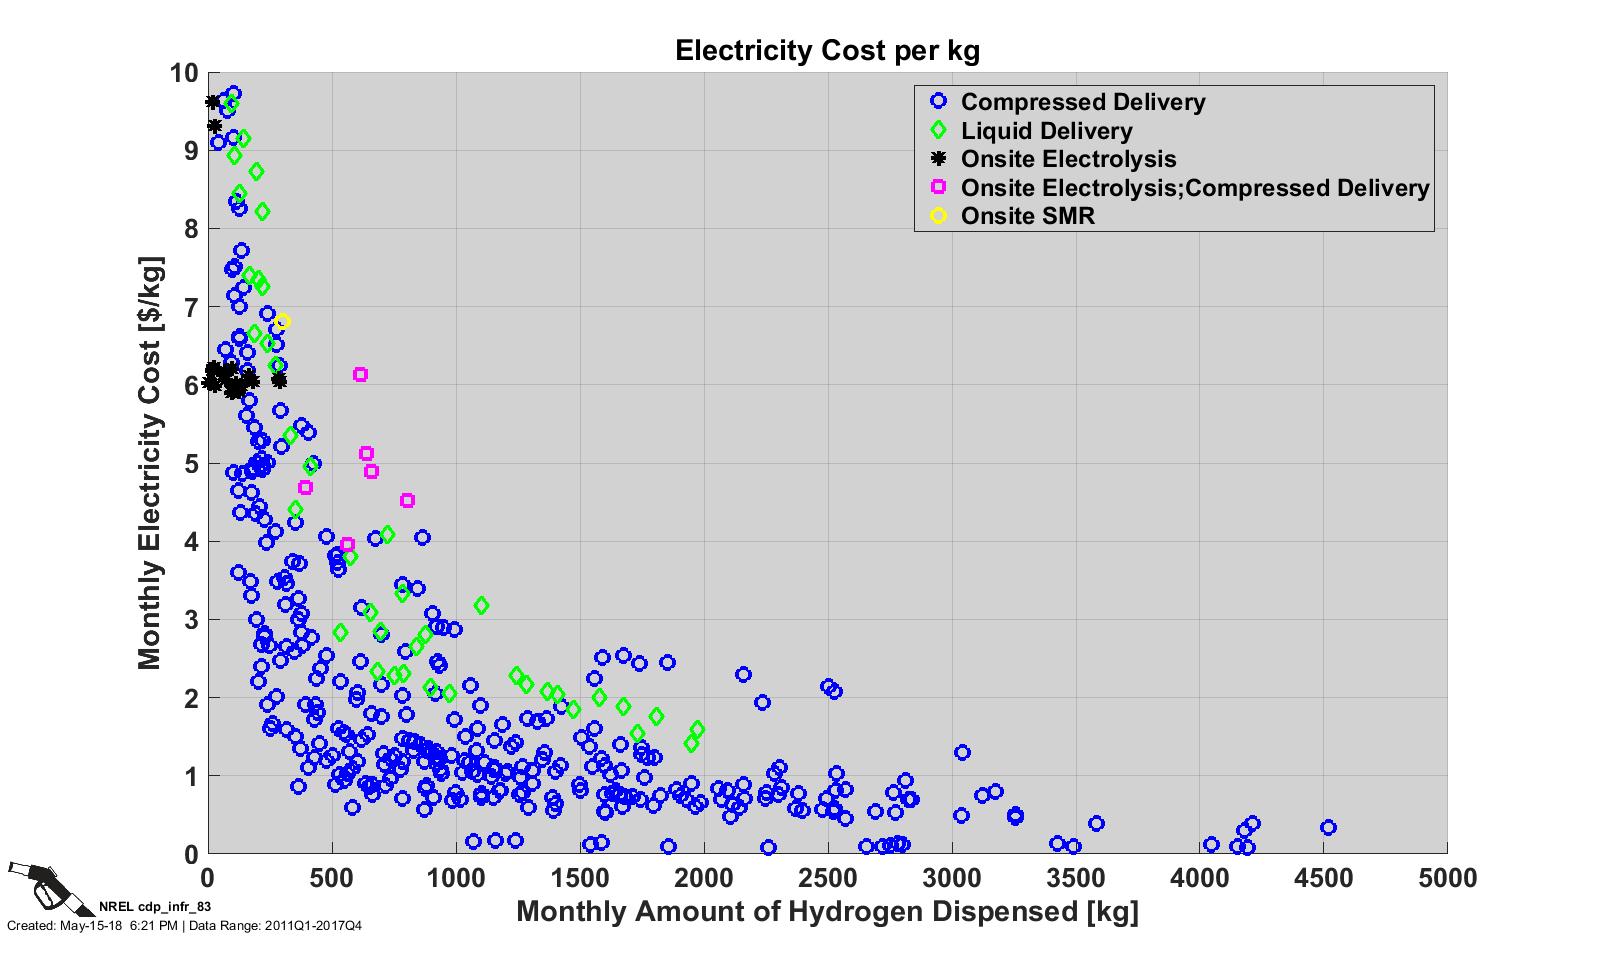
Station Energy Cost per kg Dispensed
CDP INFR 83, 5/15/18
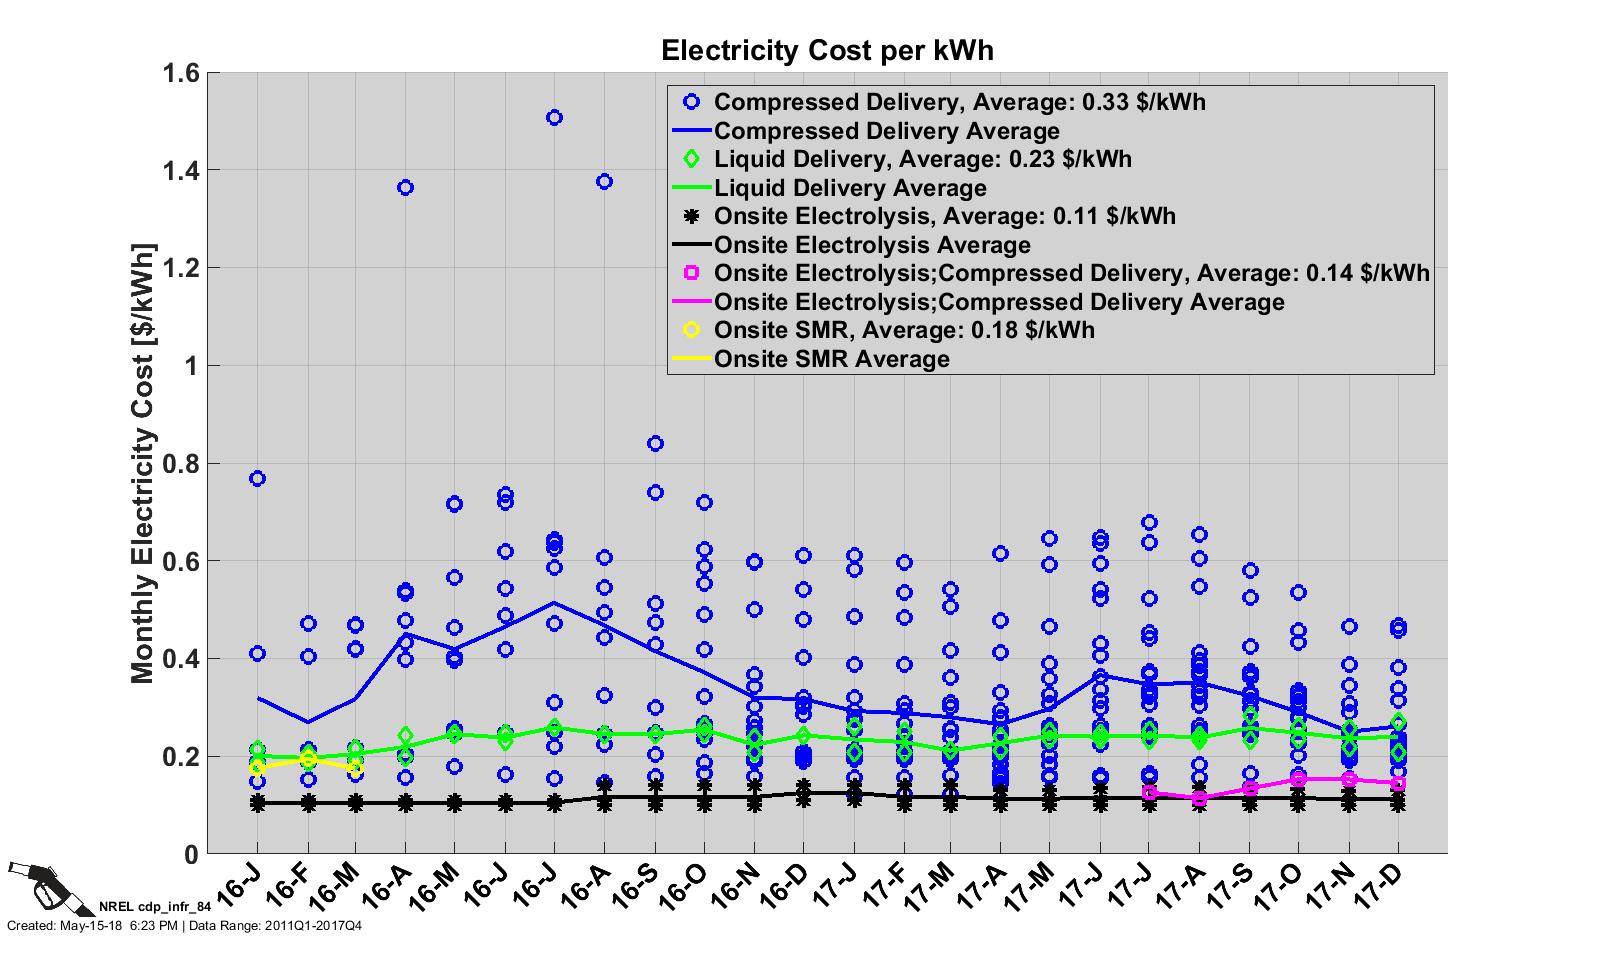
Station Electricity Cost per kWh
CDP INFR 84, 5/15/18
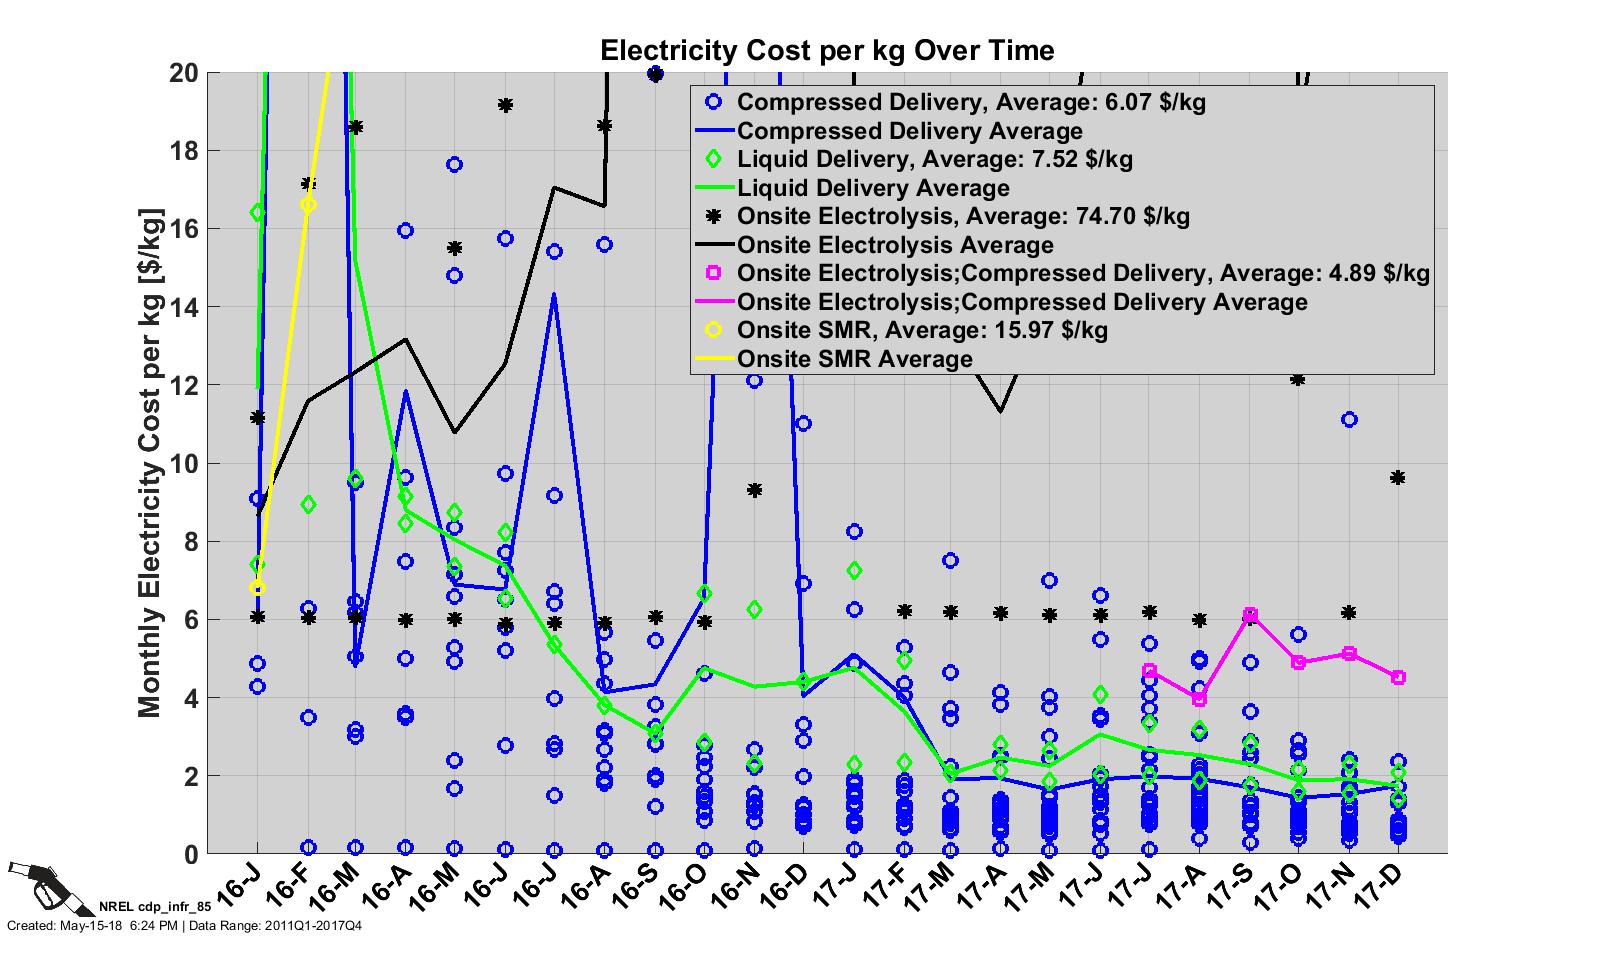
Station Electricity Cost per kg Over Time
CDP INFR 85, 5/15/18
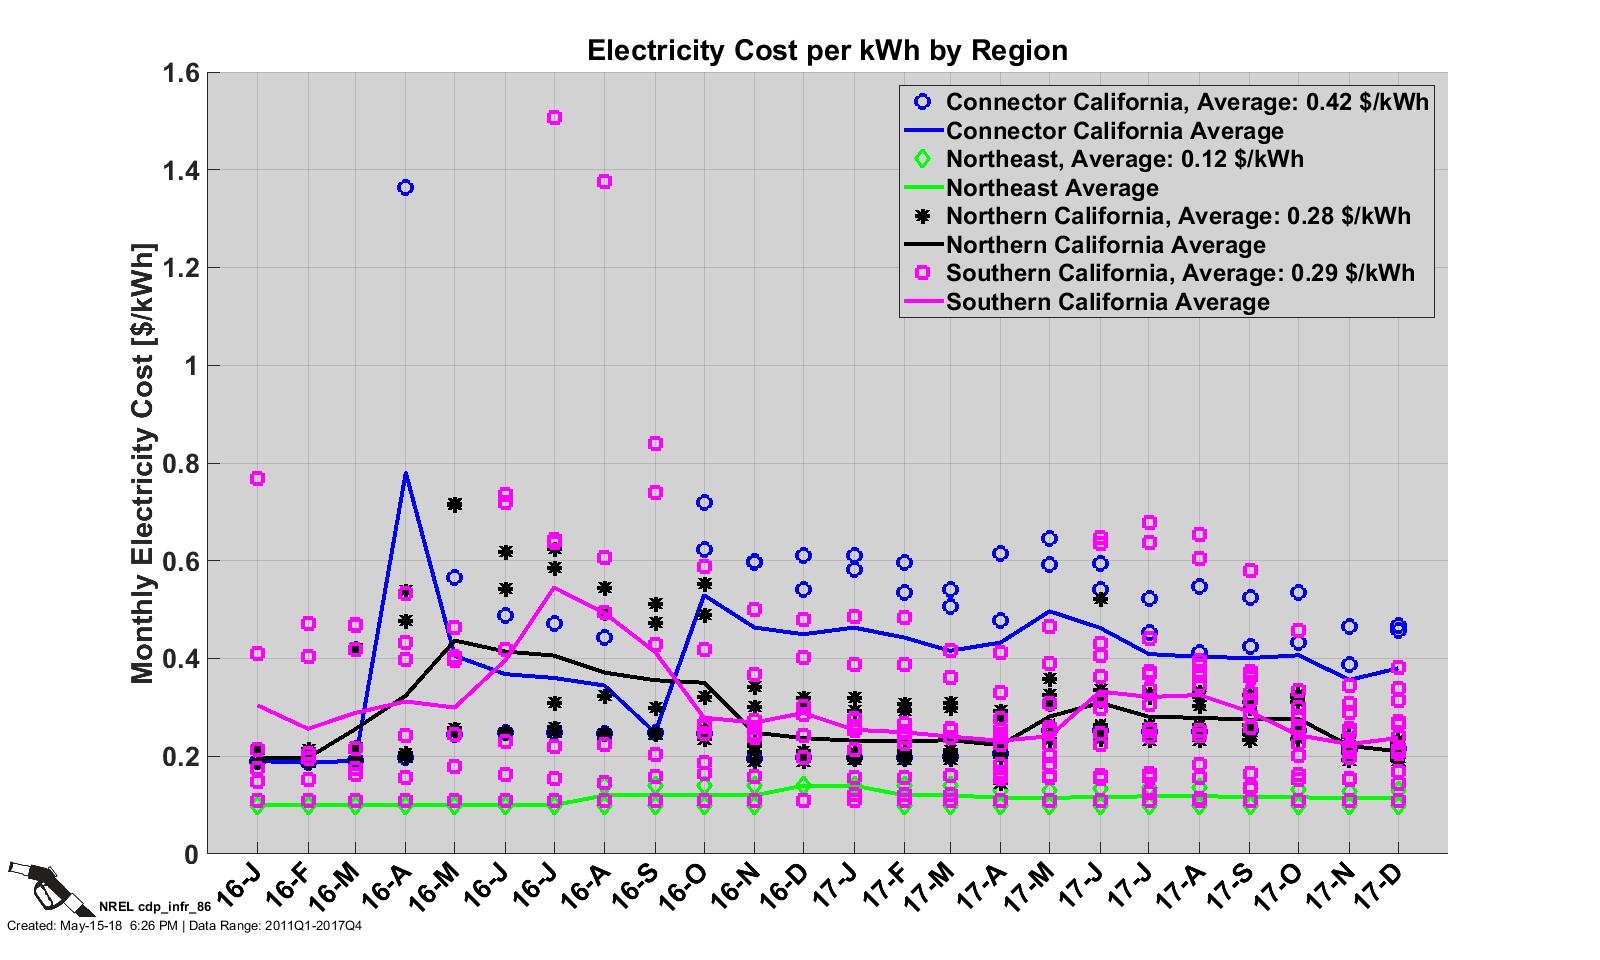
Station Electricity Cost per kWh by Region
CDP INFR 86, 5/15/18
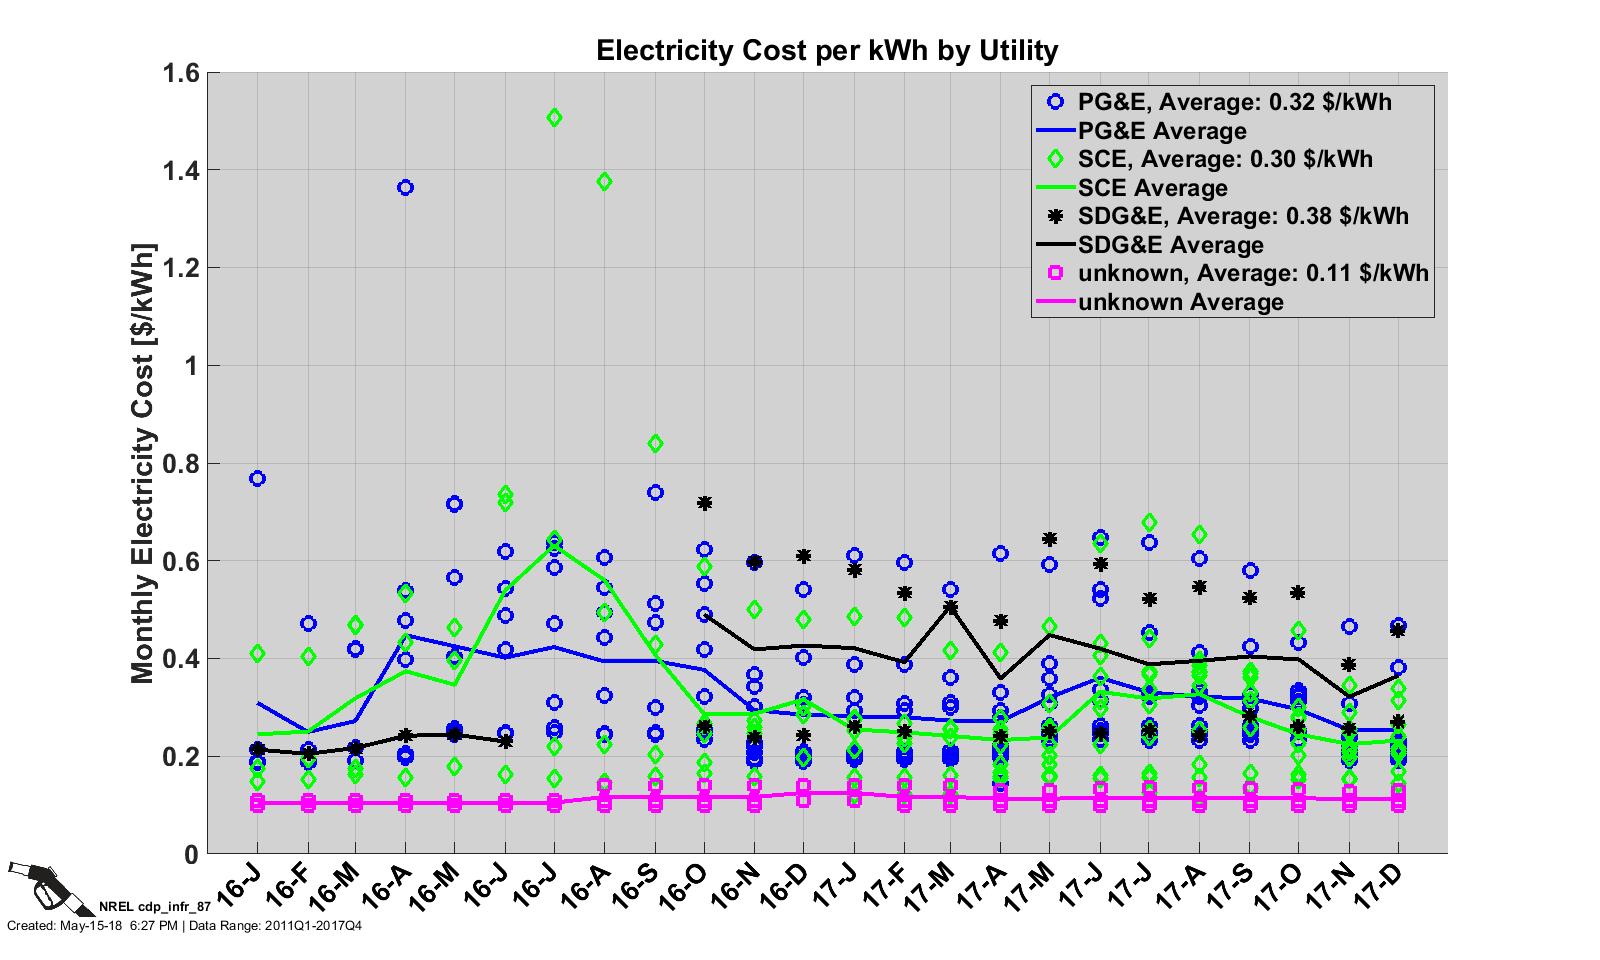
Station Electricity Cost per kWh by Utility
CDP INFR 87, 5/15/18
Share
Last Updated Feb. 10, 2025