figures
Figures can include line drawings, graphs, charts, diagrams, schematics, flowcharts, illustrations, and photographs. Be sure that computer-generated figures are clear and readable, so they can be reproduced easily. Make sure the data in your figures correspond to the data in your text and tables.
Number figures in a simple sequence (e.g., Figure 1, Figure 2). In long reports, papers, or book chapters, you may include section or chapter numbers in the figure numbers (e.g., Figure 1-1, Figure 1-2, Figure 2-1, and so on).
Use 10-pt. Arial bold for captions. The caption is centered under the illustration. For data charts and graphs, use 9-pt. Arial for source lines below the figure. See also captions.

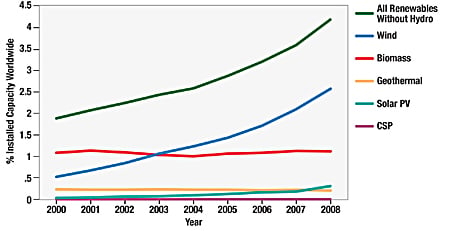
Figure 1. Renewables as a percentage of total installed capacity worldwide
No period is needed after a caption if it is an incomplete sentence (see Figure 1 above). If one or more full sentences follow the incomplete sentence (as a continuing caption or subcaption), each caption (including the opening incomplete sentence) should have a period. Don’t bold subcaptions. See Figure 2-1 below for an example.
Figure 2-1. Photoconductivity spectra of a composite CIS thin film.
Inset: The probable energy band diagram.
As required, appropriate credit and Image Gallery information should be provided for figure images. See photo and image credits. Place credit information after the caption.
Share
Last Updated Dec. 9, 2024
