Pumped Storage Hydropower Supply Curves
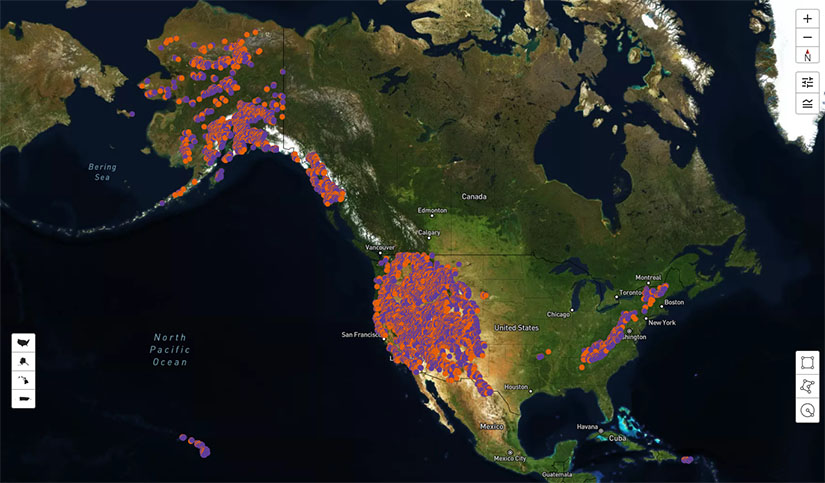
NREL has developed an interactive map and geospatial data showing pumped storage hydropower (PSH) supply curves, which characterize the quantity, quality, and cost of PSH resources.
Sites can be fully closed-loop, or they can use existing reservoirs along river systems. Supply curves are available for 8-, 10, and 12-hour storage durations, dam heights of 40–100 meters, head heights of 200–750 meters, and a maximum conveyance length between upper and lower reservoir of 12 times the head height (leading to a maximum horizontal distance between reservoirs of 8,250 meters for a 750-meter head height system). The dataset includes sites that use existing reservoirs to connect new off-river reservoirs with upper reservoirs and sites that repurpose open-pit mines for use as PSH reservoirs.
Explore the map’s latest features:
- Explore new site opportunities that use existing reservoirs.
- Investigate sites that use open-pit mines as reservoirs.
Interactive Map and Geospatial Data
The PSH geospatial data include storage duration, paired reservoir volume, capacity, distance between reservoirs, head height, transmission spurline distance, transmission spurline costs, and total cost. Data can be downloaded directly from the interactive map.
Supply Curves Development
NREL developed the PSH resource assessment and supply curves by adapting geospatial algorithms and a cost model developed for the Australian National University (ANU) Global Greenfield Pumped Hydro Energy Storage Atlas. NREL adapted the model to reflect U.S.-specific inputs and modeling needs to better represent PSH technology development potential in tools such as NREL's Regional Energy Deployment System (ReEDS) model.
Resource potential is often assessed in terms of geographic (or resource), technical, and economic potential—each of which represents a succession of additional complexity and input assumptions that leverage similar data and a common analysis flow.
The closed-loop portion of the PSH resource assessment uses high-resolution digital elevation models (30-meter resolution) to identify potential upper and lower reservoirs within the technology parameters specified by the NREL adaptation of the ANU model. Design specifications include minimum head height of 200 meters and a maximum head height of 750-meters, dam heights of 40, 60, 80, and 100 meters, and a maximum conveyance length between upper and lower reservoir of 12 times the head height. This yields a large set of potential reservoirs with many overlaps.
Once the reservoirs are identified, technical potential criteria are applied to refine the development areas. The criteria eliminate any reservoirs that intersect existing water bodies and waterways; glaciers and ice-covered areas, protected federal lands; urban areas; critical habitat areas; or reservoirs within 1,000 feet of a wetland. Optional criteria can eliminate reservoirs intersecting roads or farmland or allow reservoirs intersecting ephemeral streams.
To find potential sites that use open-pit mines as reservoirs, NREL researchers search for pit features using 10-meter-resolution digital elevation models, removing any pits smaller than 10,000 square meters in area and shallower than 1 meter in depth. Pits are then identified by searching within 1 kilometer of mine locations in the U.S. Geological Survey mine symbol dataset and visually inspecting the results to remove errors.
After applying technical potential criteria, the remaining upper and lower reservoirs are evaluated for capacity (upper and lower reservoir capacity must be within 10% of each other), the 12× distance criteria, and total paired system cost. Exceptions are made for existing reservoirs, where the size similarity criterion is not enforced, and for mine pits, where head heights as low as 100 meters are allowed. The paired reservoirs are then optimized by cost to develop a non-overlapping reservoir dataset for each combination of assumed storage duration (8, 10, or 12 hours in this dataset) and optional technical potential criteria. Total costs include hydropower site and transmission development. The site development costs are taken from NREL’s bottom-up component-level PSH cost model, except for open-pit mine sites, which are not assigned costs because of high uncertainty. Retrofit costs to use existing reservoirs are also uncertain, so costs for sites using existing reservoirs are approximated by excluding the cost of that reservoir and dam. In addition, transmission spurline costs are taken from NREL analysis supporting the ReEDS model. See ReEDS Model Documentation Version 2020, NREL Technical Report (2021).
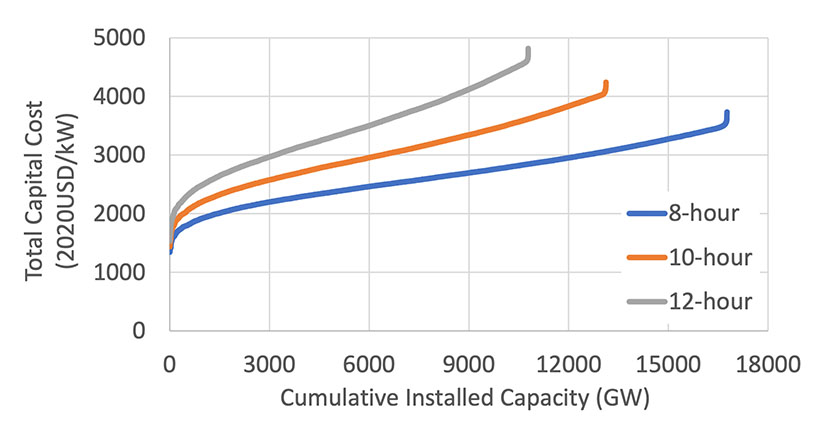
Ultimately, this exercise results in a spatially resolved characterization of the technical potential quantity, quality, and cost of PSH resources, which can be sorted to represent a "supply curve" for a specific scenario. The figure below plots the supply curve of closed-loop PSH capital cost in dollars per kilowatt versus cumulative generating capacity in gigawatts for the contiguous United States for 8-, 10-, and 12-hour storage durations and the default assumptions for where to prohibit or exclude closed-loop PSH construction. This supply curve includes both closed-loop sites and sites that use existing reservoirs. Resource and cost data binned by cost ranges are also included in the NREL Annual Technology Baseline beginning in the 2022 data year.

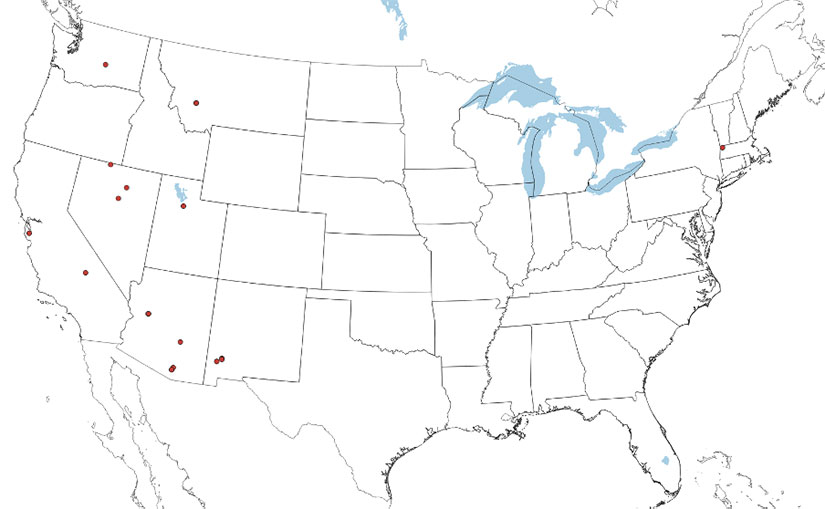
The open-pit mine PSH site assessment, where pits are paired with potential off-river reservoirs, finds 15 candidate locations, as shown on the map below. These are mostly scattered throughout the western United States, with one site in Massachusetts. Many of these sites include active mining operations, so PSH development would compete with existing site use.

The latest (third-generation) dataset includes several updates and changes from the methodology described in the original (first-generation) report. Incorporating stakeholder participation and review, the updated data better reflects the range of technical possibilities for designing closed-loop PSH in the United States and supplements closed-loop opportunities with sites that can use existing reservoirs and open-pit mines as reservoirs. It also integrates updated geospatial data where possible and includes multiple scenarios for storage duration, dam height, and several site exclusion criteria. While some changes limit the range of system specifications to better capture realistic design constraints, multiple dam heights and a lower minimum head lead to many more sites being identified in the second-generation dataset, and expansions in the third-generation data incorporate potential low-cost development opportunities that are not included in the closed-loop data. The other key difference in the third-generation data is that costs are estimated using NREL’s bottom-up component-level cost model, whereas first-and second-generation costs are estimated using ANU’s pumped hydro energy storage cost model with costs adjusted to align with industry expectations published in the 2020 Grid Energy Storage Technology Cost and Performance Assessment.
| Technical Characteristic | First Generation Data | Second/Third Generation Data |
|---|---|---|
| Storage duration | 10 hours | 8, 10, and 12 hours |
| Minimum head | 300 meters | 200 meters* |
| Maximum head | None | 750 meters |
| Maximum distance between reservoirs | 4.5 kilometers | Enforced by maximum length:head ratio |
| Maximum conveyance length to head ratio | 16 | 12 |
| Dam heights available | 40 meters | 40, 60, 80, and 100 meters |
| Reservoir search radius from an identified dam location | 5.5 kilometers | 7 kilometers |
| Reservoir volume similarity requirement | Within 20% | Within 10%** |
*Sites utilizing open pit mines as reservoirs have a minimum head of 100 meters.
**The reservoir volume similarity criteria is not enforced when pairing existing reservoirs with potential off-river reservoirs.
| Technical Potential Criteria | First Generation Data | Second/Third Generation Data |
|---|---|---|
| Glacier/ice exclusion | None | Enforced using National Land Cover Database 2019 |
| Wetlands exclusion | Enforced using National Land Cover Database 2016 | Enforced using National Land Cover Database 2019 |
| Urban areas exclusion | Enforced for Global Human Settlement Layer 2019 Classes 30:13 | Enforced for Global Human Settlement Layer 2019 Classes 30:12 |
| Existing stream exclusion | All National Hydrography Data stream types excluded (persistent, intermittent, ephemeral) | Additional scenarios allow reservoirs on ephemeral streams |
| Roads exclusion | None | Additional scenarios prohibit reservoirs intersecting major highways in 2020 U.S. Census Bureau TIGER/Lines data |
| Agricultural land exclusion | None | Additional scenarios prohibit reservoirs on farmland, denoted as "cropped area" in 2018 U.S. Geological Survey Global Food Security-Support Analysis Data |
Learn more about NREL's renewable energy supply curves or check out this webinar demonstrating the resource assessment and supply curves tool.
Publications
A Component-Level Bottom-Up Cost Model for Pumped Storage Hydropower, NREL Technical Report (2024)
Closed-Loop Pumped Storage Hydropower Resource Assessment for the United States, NREL Technical Report (2022)
Advanced Hydropower and PSH Capacity Expansion Modeling, NREL Technical Report (2022)
Contacts
Share
Last Updated March 10, 2025

